Digital Experience
Ensure that all your applications are available, functional, fast, and efficient across every channel, from mobile and web to IoT and APIs.
Real user monitoring
Analyze and manage real user monitoring (RUM) data of web, mobile, and custom applications.
Web monitoring
Analyze and manage real user monitoring (RUM) data of Web applications.

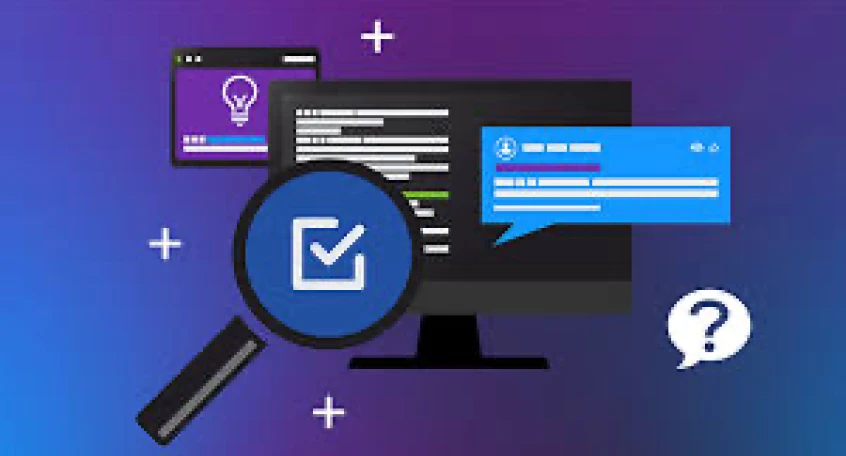
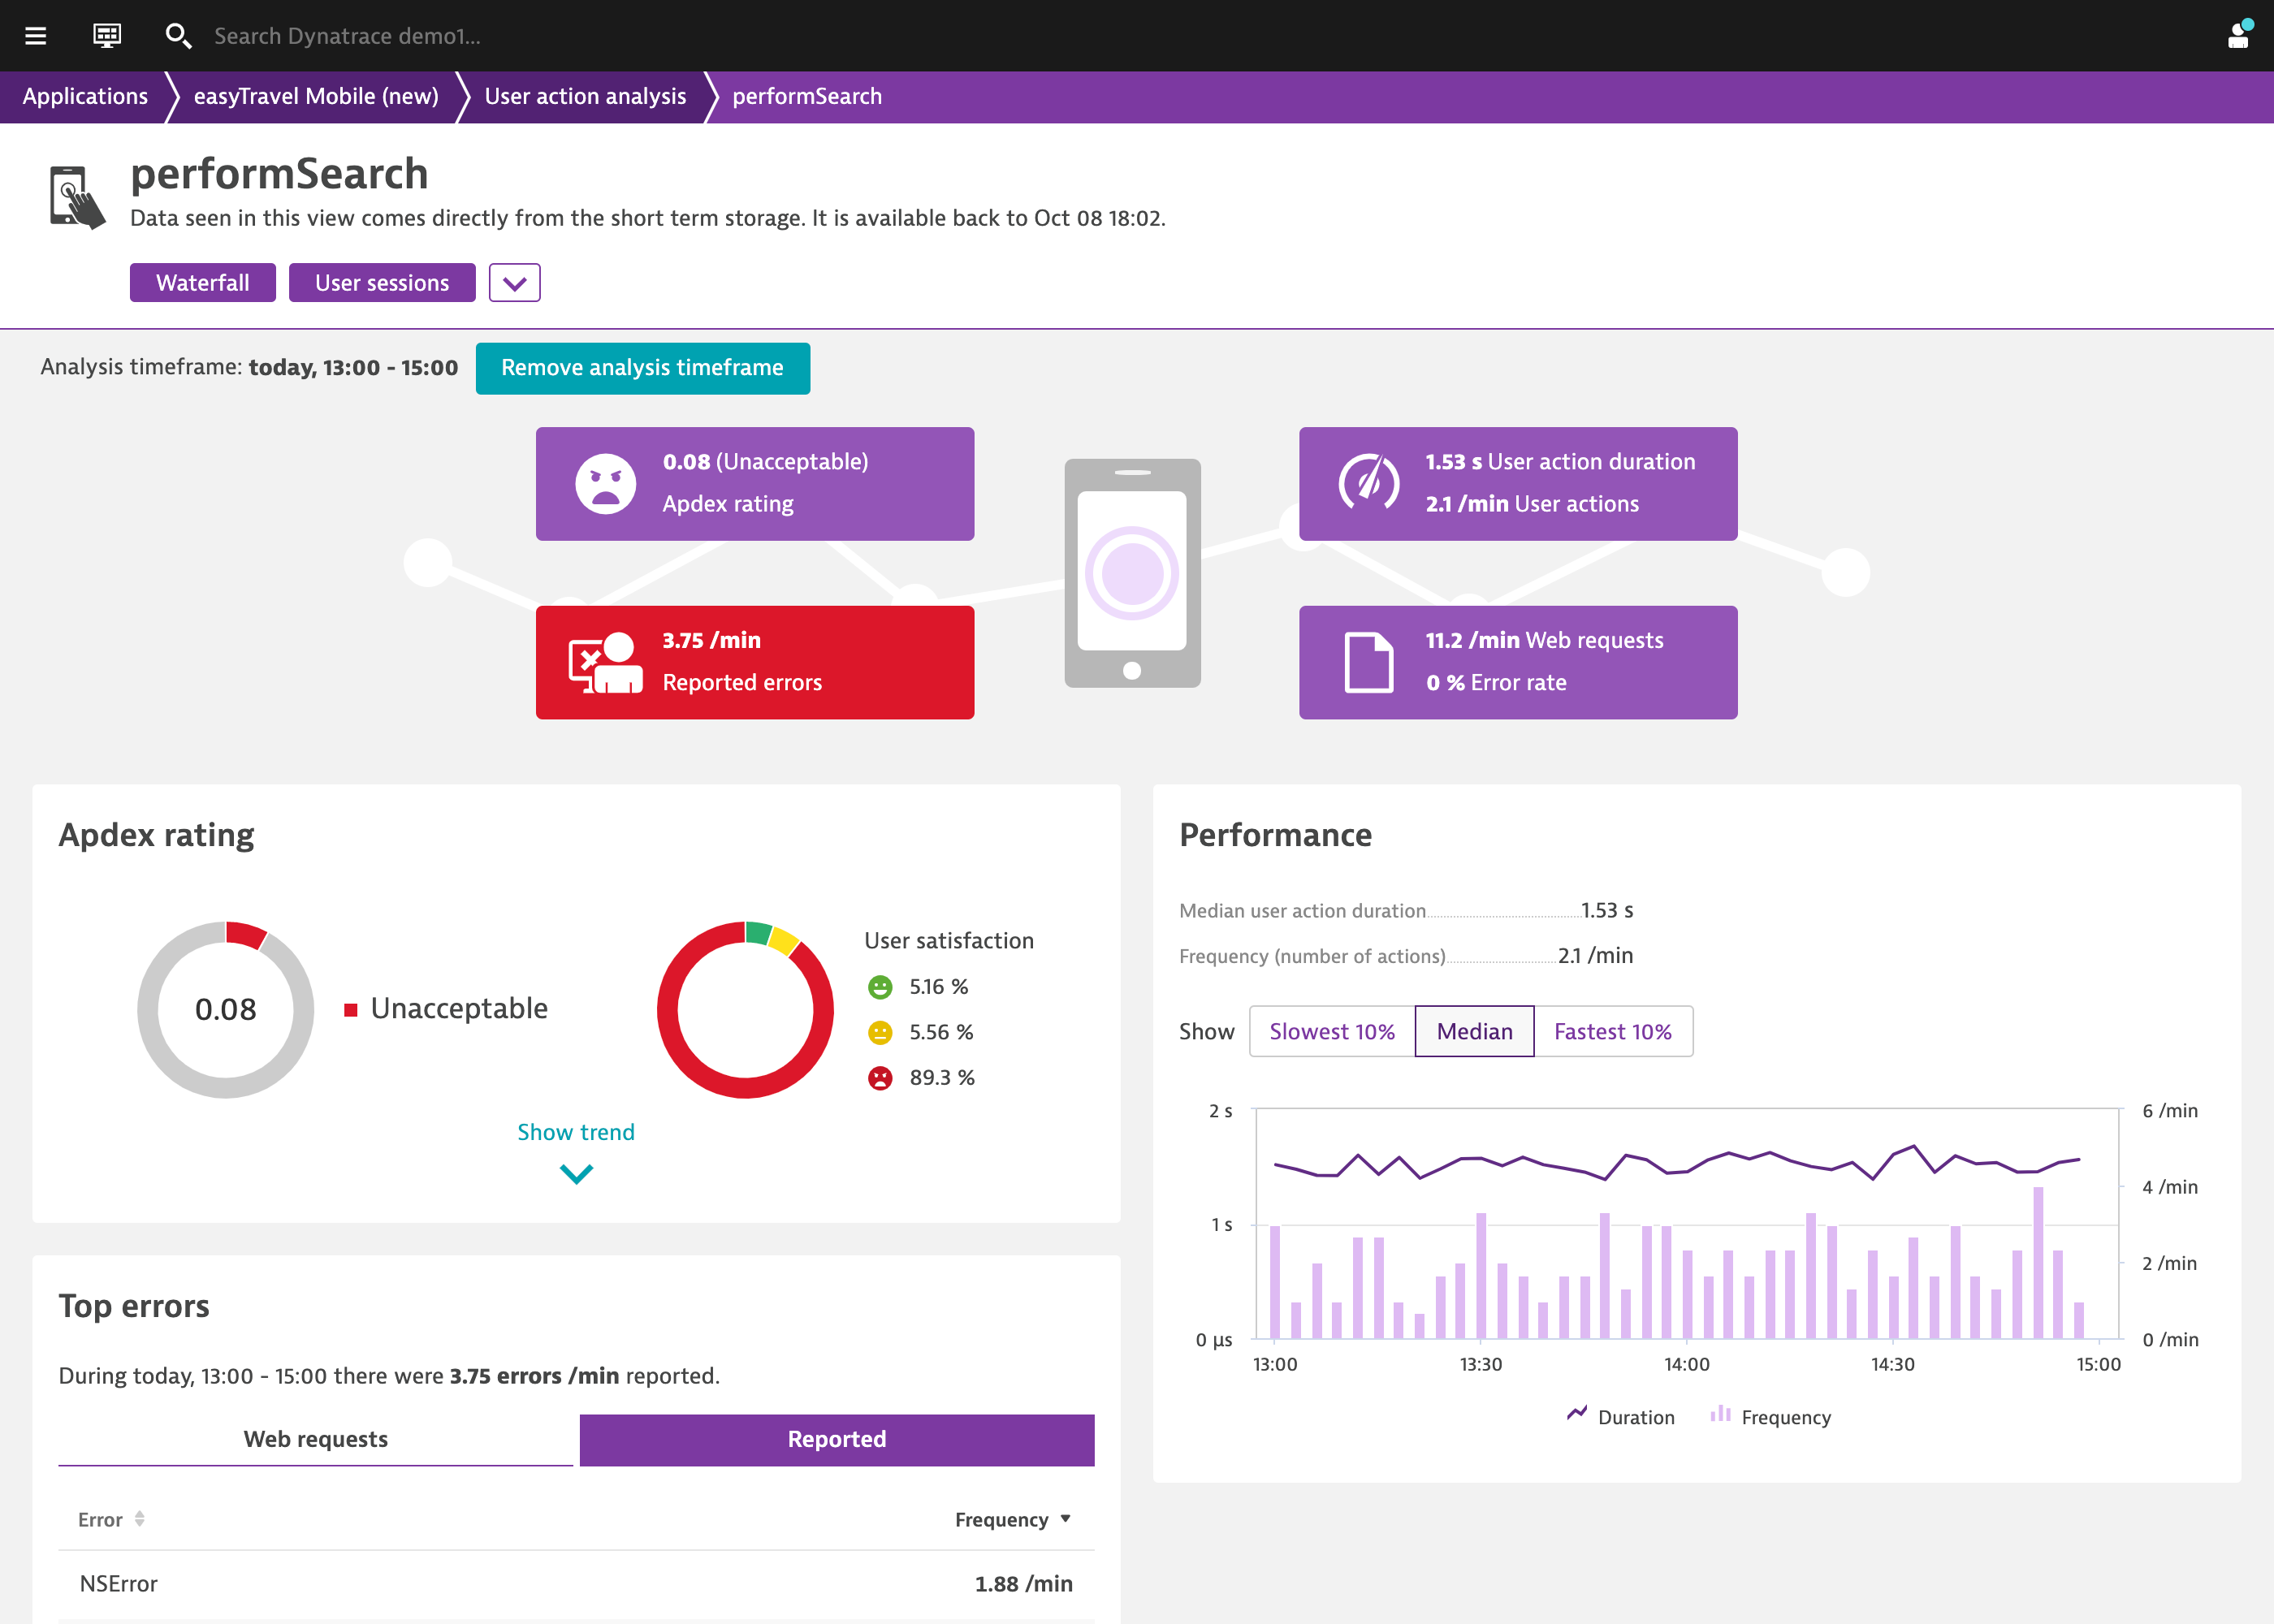
Mobile monitoring
Analyze real user monitoring data of mobile apps in context with the backend.
Custom frontend monitoring
Monitor custom frontend applications with our open source OpenKit library.
Session Replay
Fix bugs and simplify complex issues with visual recordings of user sessions.

Session segmentation
View and analyze the Real User Monitoring (RUM) sessions from all applications.
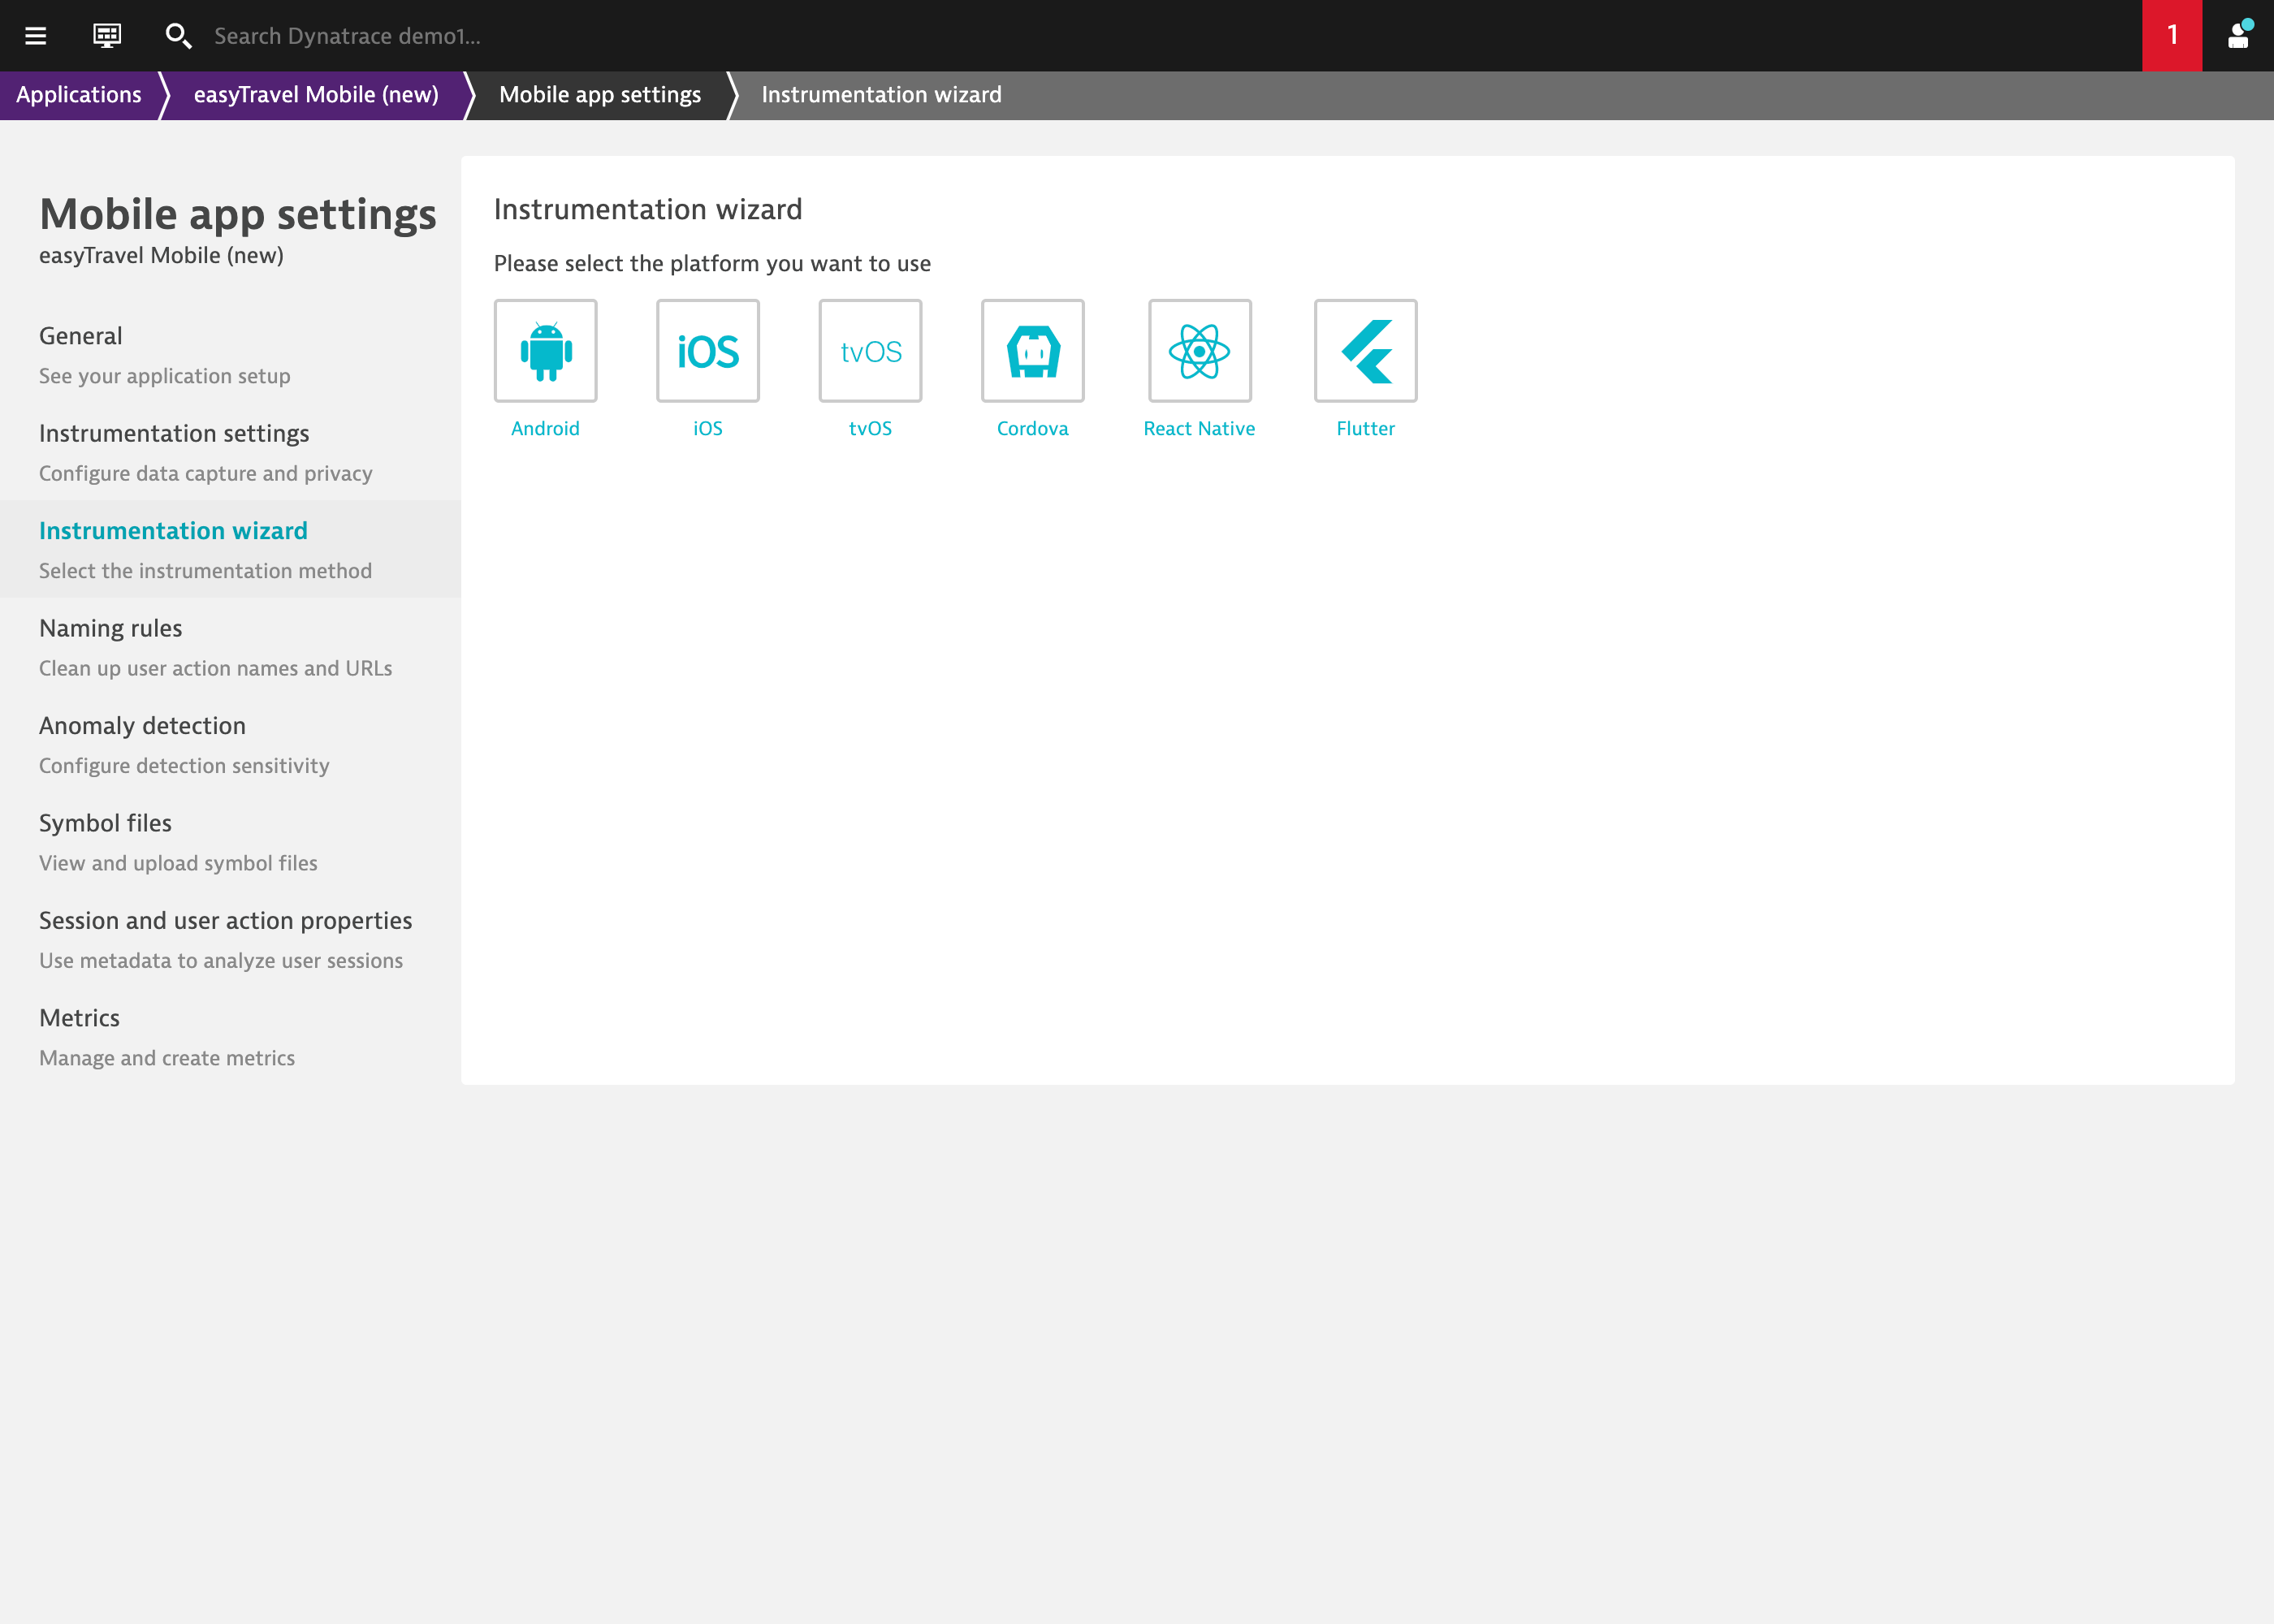
Query user sessions
Query completed user sessions with user sessions query language (USQL).
More resources
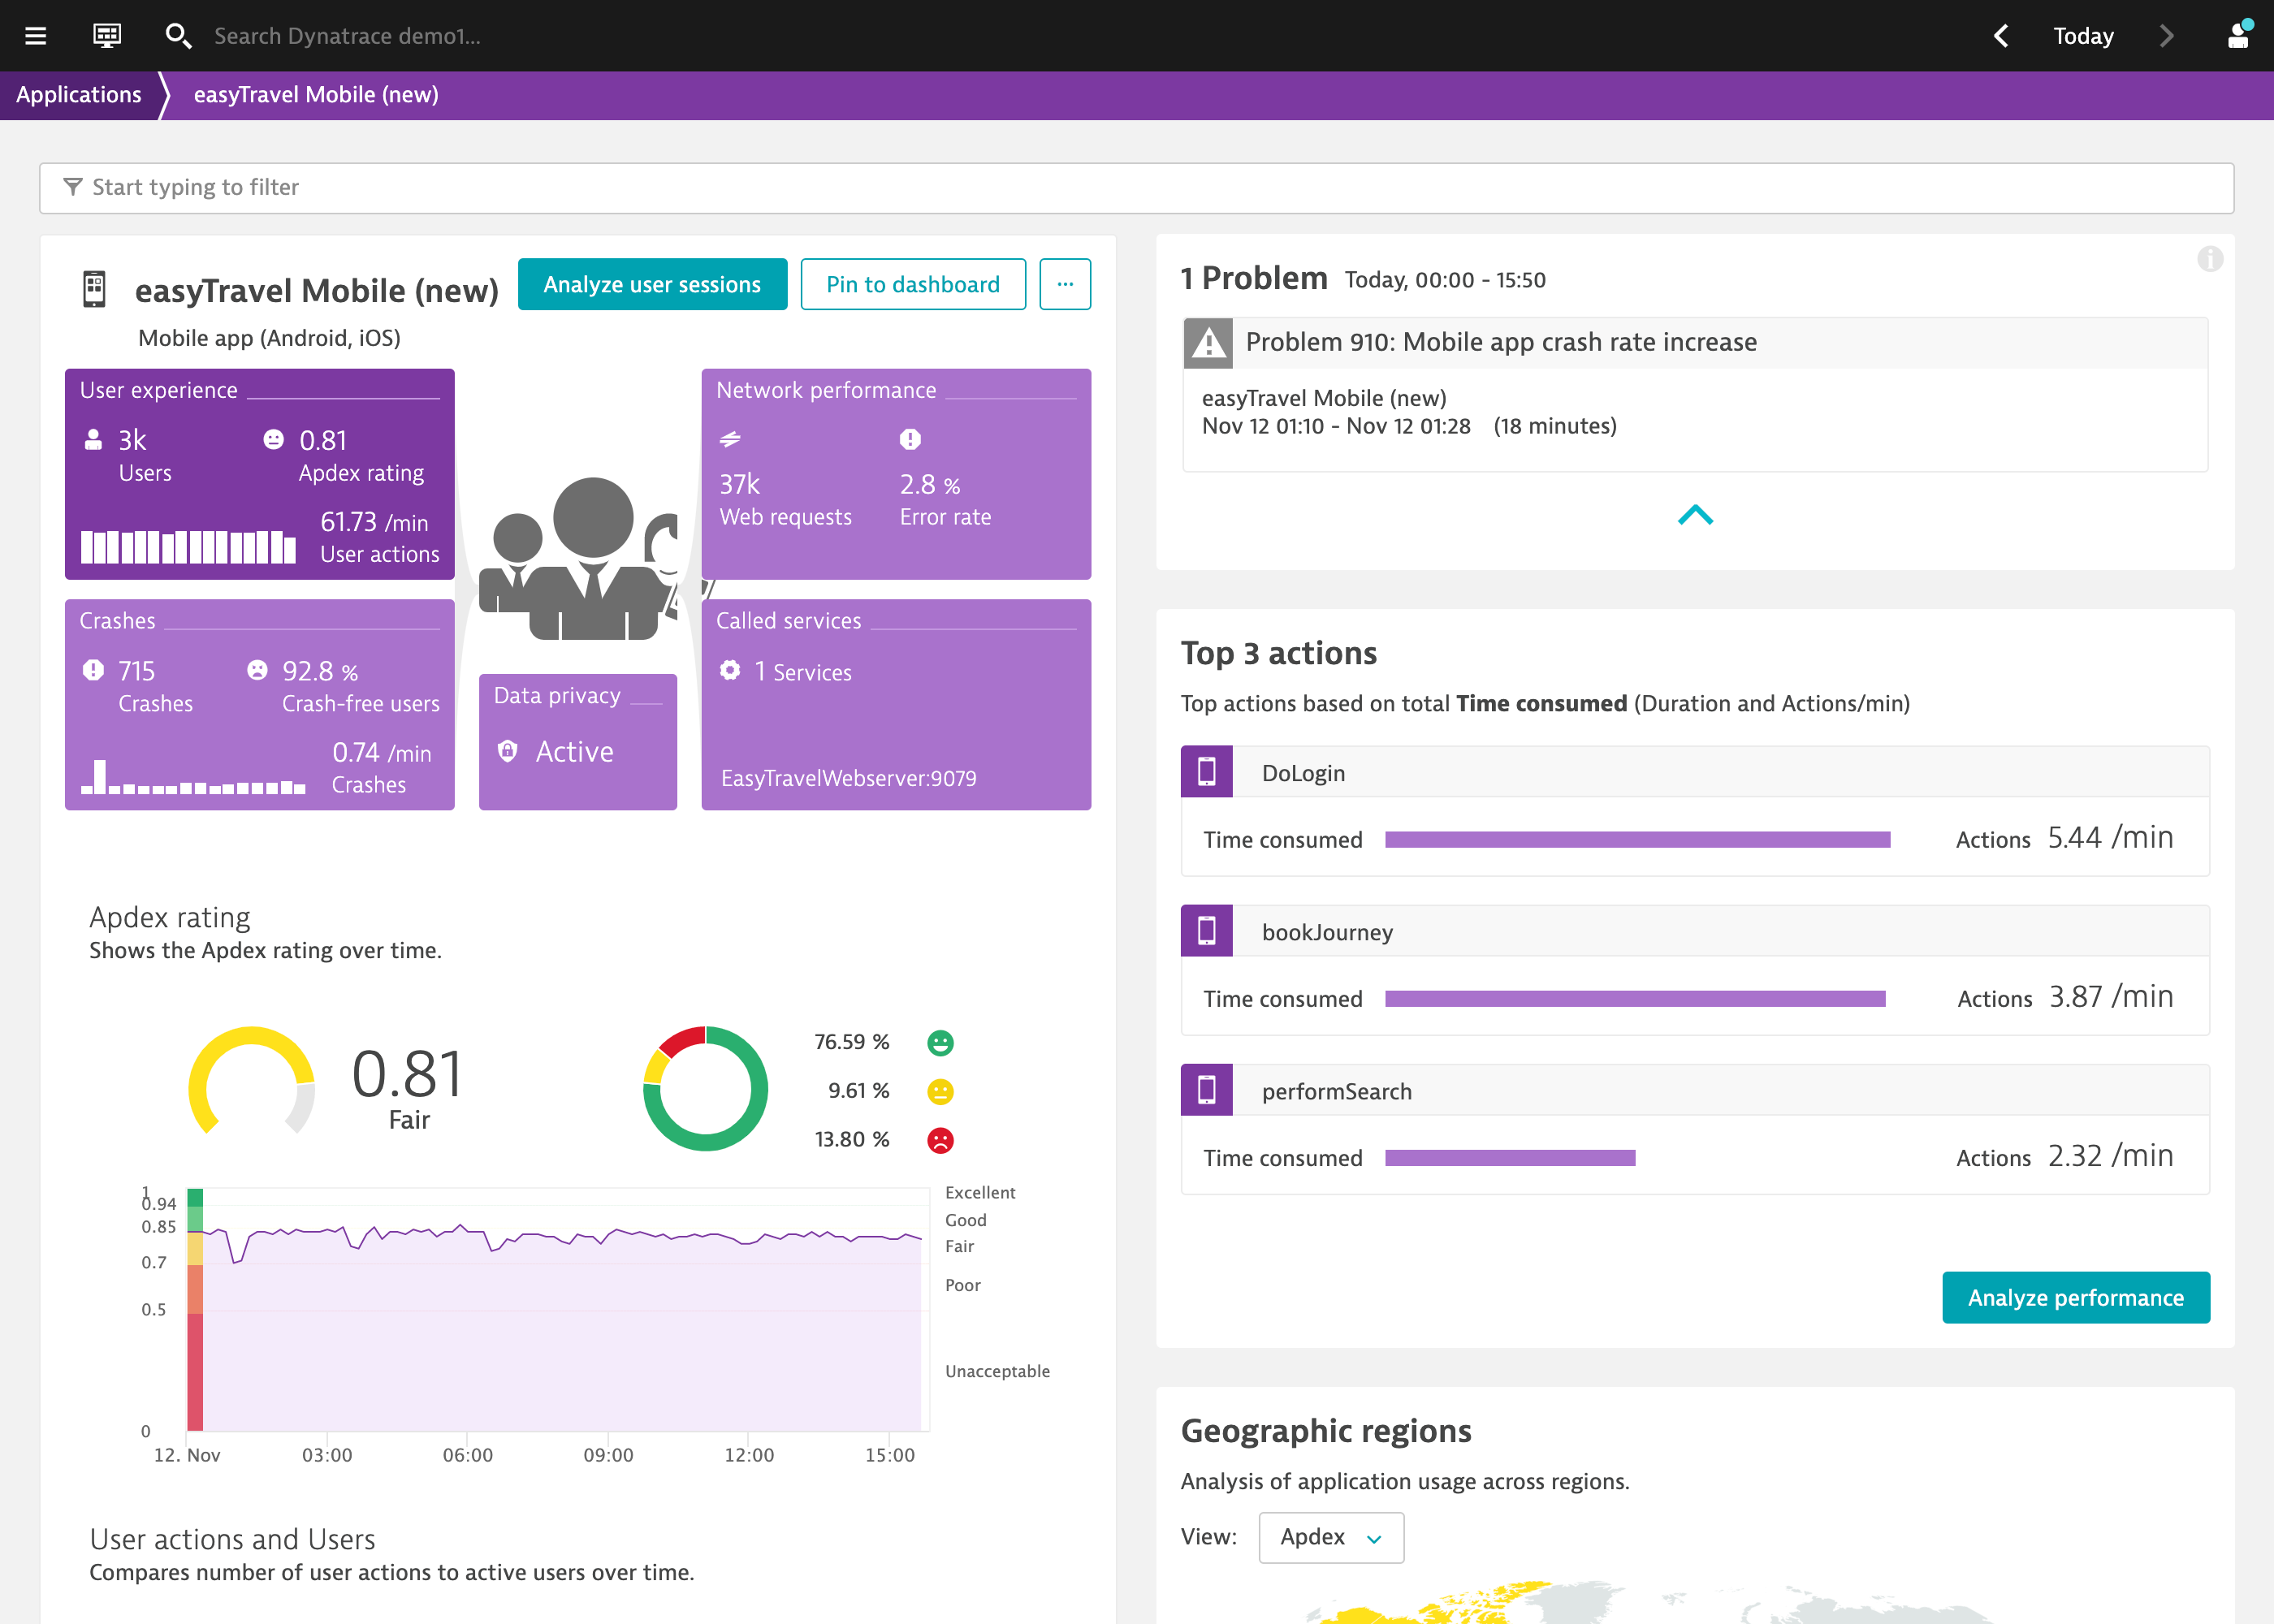
Flutter
Monitor mobile applications built with Flutter on iOS or Android.
Google Chrome
Cross-platform web browser developed by Google.

Android
Monitor mobile applications that are running on the popular Android operating system.
Android Webkit
Provides tools for browsing the web.
Xamarin
Monitor mobile applications built with Microsofts's popular Xamarin platform running on iOS or Android.
Xcode
Environment containing a suite for developing software for macOS, iOS, iPadOS, watchOS, and tvOS.
Apache Cordova
Monitor hybrid mobile apps built with Cordova running on iOS or Android.
iOS
Monitor mobile applications that are running on Apple's popular iOS operating system.
iOS Safari
Graphical web browser developed by Apple, based on the WebKit engine.
Apple Safari
Graphical web browser developed by Apple, based on the WebKit engine.
Microsoft Edge
Real user monitoring - visibility and monitoring starting on you clients browser (desktop, tablet, mobile).
Microsoft Internet Explorer
Series of graphical web browsers.
Mozilla Firefox
Free, open source web browser that uses the Gecko layout engine.
Opera
Freeware web browser for Microsoft Windows, Android, iOS, macOS, and Linux operating systems.
React Native
Monitor mobile applications built with React Native running on iOS or Android.
Support

Crash-free, 5-star mobile apps
Learn to leverage mobile analytics to fix app performance issues before they impact your users and revenue.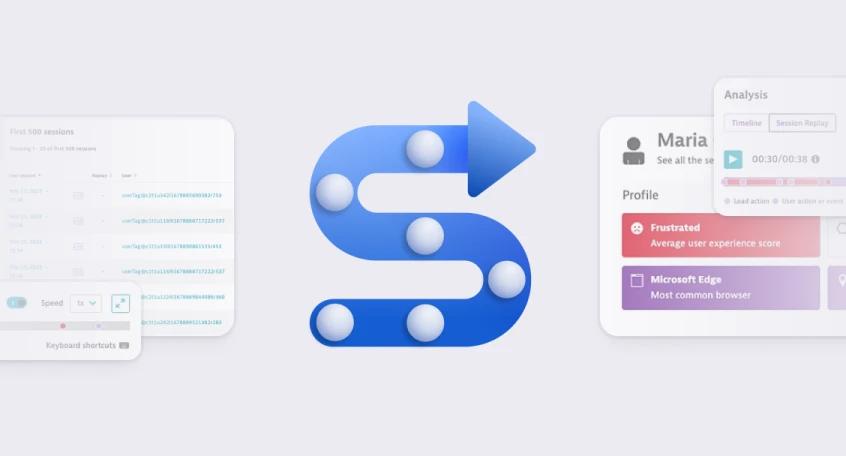
Connect logs for better user journeys
Deepen your insights into real user journeys and user experience pitfalls when you connect logs to session replay.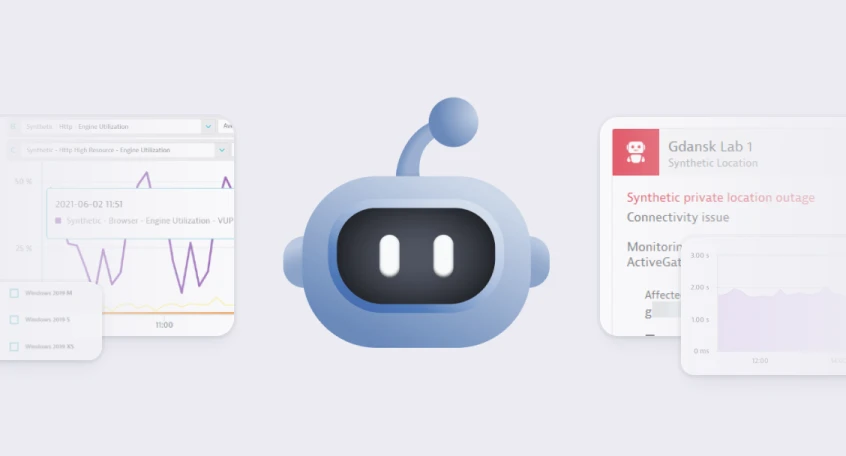
Maintain location health the easy way
Learn to use private synthetic locations to immediately identify which of your locations need personal attention.
An end to Android app crashes
Dynatrace mobile app monitoring enables immediate, accurate analysis of real user sessions on Android as well as iOS.
Simpler, easier mobile monitoring
Learn how to make our automated, all-in-one approach to monitoring mobile apps work for you.