
Automatic business impact analysis
Dynatrace automatically quantifies how performance problems affect your customers.
Proactively identify the potential customer impact of problems
Dynatrace artificial intelligence not only automatically pinpoints the underlying root cause of a performance problem, it also automatically quantifies the impact that problem has on your customers.
Each problem notification generated by the anomaly detection engine includes a business impact analysis that shows the number of impacted users and service calls for each affected application.
- Immediately see where and how performance issues affect customers.
- Prioritize troubleshooting to focus on problems that impact many users, not just a couple of outliers.
- See exactly which user actions and service methods are affected.

How automatic business impact analysis works
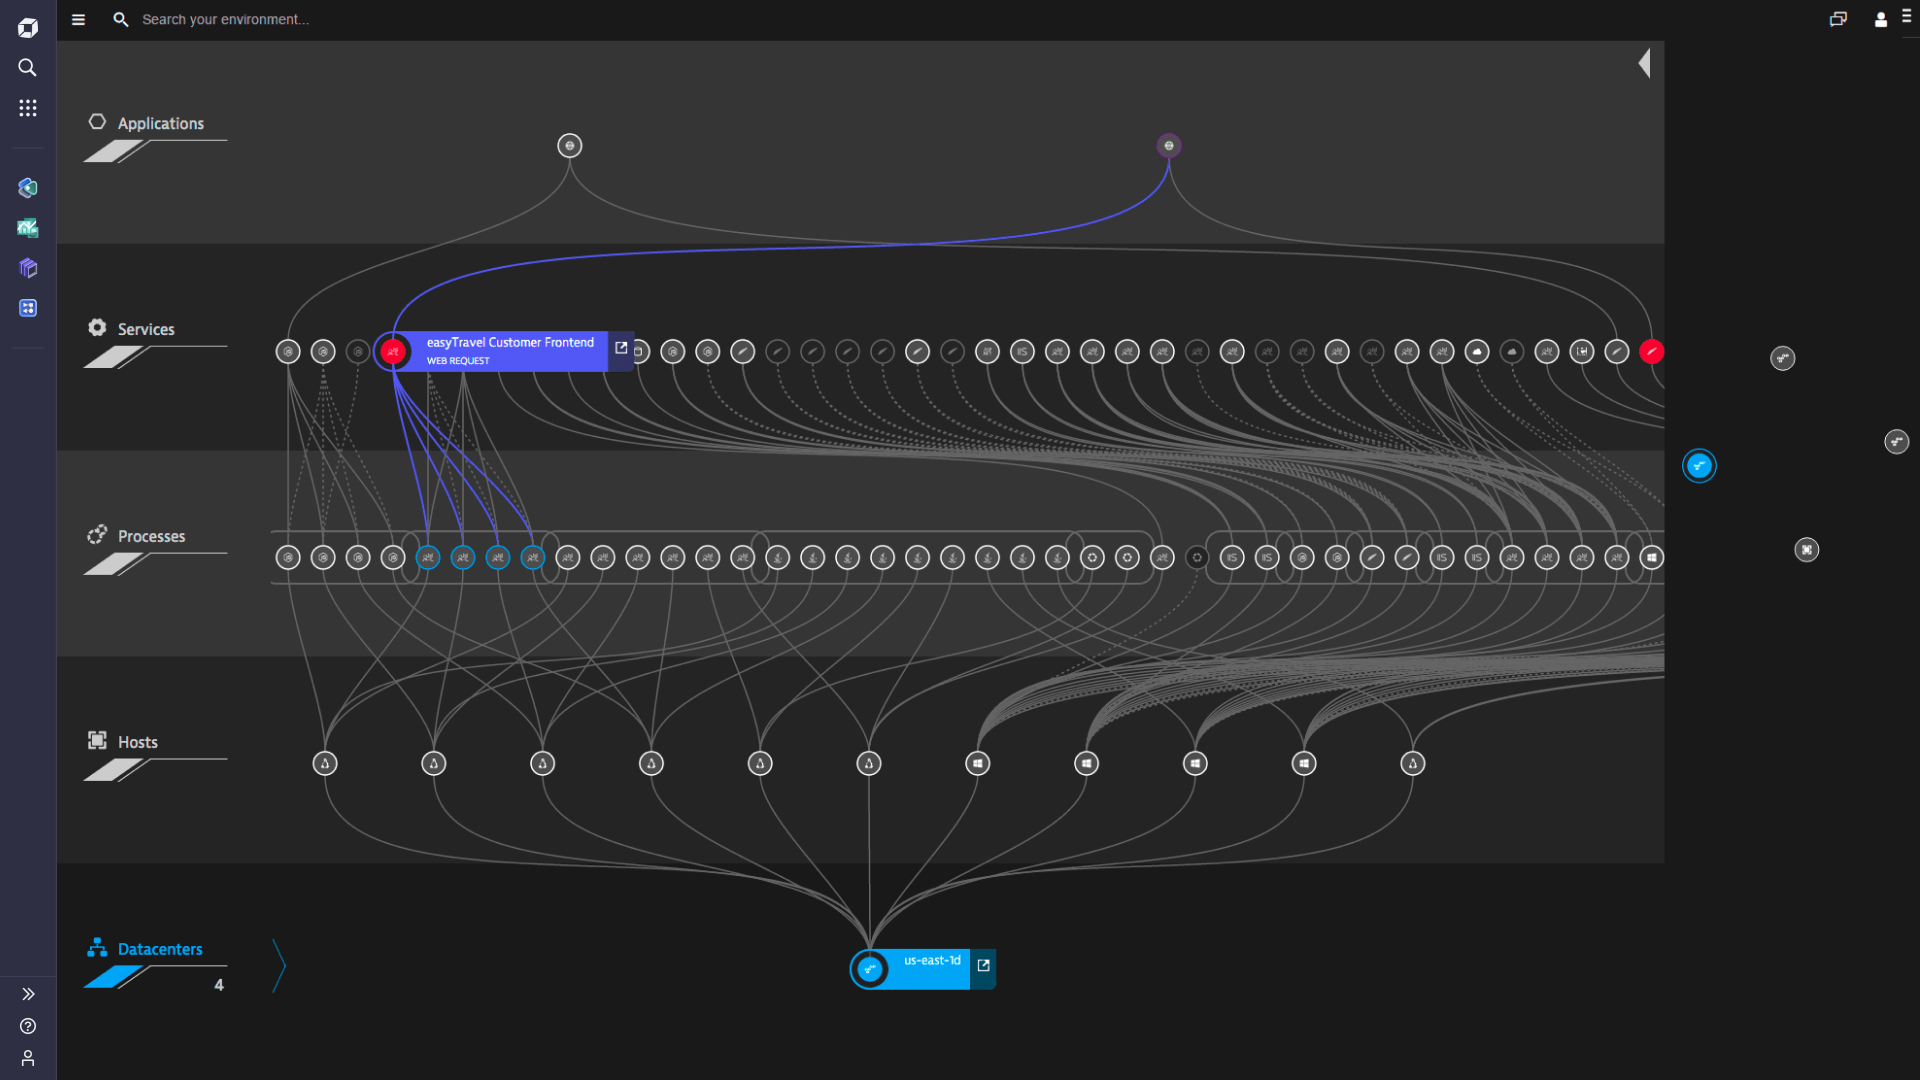
As soon as the anomaly detection engine identifies a performance problem, Dynatrace collects and analyzes all relevant transactions—from the affected nodes up to their entry points (customer-facing application or service)—and counts the number of distinct real users who have faced the problem so far.
- Only Dynatrace has PurePath technology to capture metric detail from each individual transaction end to end across every tier of your application technology stack.
- Other APM vendors rely on samples and snapshots.
- Patented Smartscape technology provides real-time topological information to "connect the dots" among components and dependencies.

Instead of waiting for a customer to call in and report a problem, we can now see where the problems and slow applications occur and fix them before they affect the customers.Anders Klintelius CTO at Stratsys
Know about customer problems that don't trigger alerts
Uncover customer experience problems that statistical baselining can't detect. By collecting and analyzing all transactions related to a problem, Dynatrace business impact analysis brings to light problems that are otherwise impossible to detect based on statistical evidence alone (e.g., threshold or baseline violations)—for example, customers being unable to log in to your application.

One-click drill-down into details
Dynatrace consolidates all related performance issues into a single actionable notification. And it's just a quick click into a wealth of details from each notification.
- Service call links take you directly to service flow analysis, which maps out how every single individual service request behaves and performs end to end.
- Click into details about affected applications and user actions: browsers/devices, geolocations, OS, number of actions, and more.
- All details are presented within the context of the problem, providing information about what was going on before, during, and after the problem.

Get a free trial


A Leader in the 2023 Gartner® Magic Quadrant™ and ranked #1 in the Critical Capabilities for APM and Observability reports
See why we’re positioned furthest for Vision and highest for Execution in the Magic Quadrant, and ranked #1 in all Use Cases in the Critical Capabilities Report for Application Performance Monitoring and Observability.

