CouchDB monitoring
App centric CouchDB performance monitoring.
What is CouchDB?
Apache CouchDB is open source database software that focuses on ease of use and having an architecture that "completely embraces the Web". It has a document-oriented NoSQL database architecture and is implemented in the concurrency-oriented language Erlang; it uses JSON to store data, JavaScript as its query language using MapReduce, and HTTP for an API.
Start monitoring your CouchDB databases in under 5 minutes!
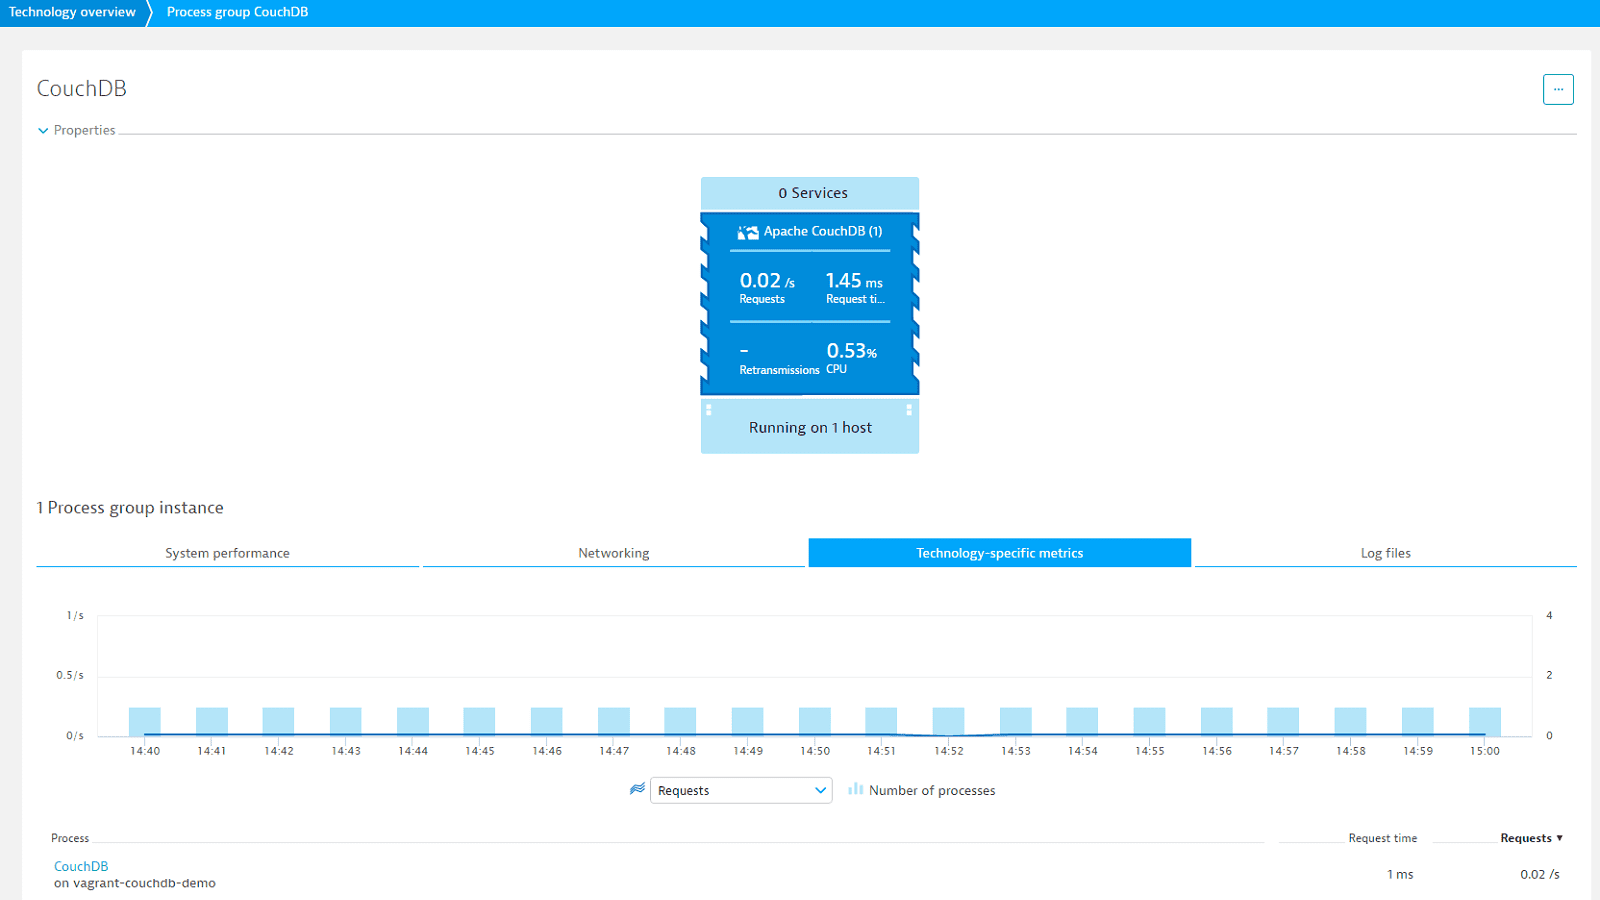
In under five minutes, Dynatrace detects your CouchDB databases and shows metrics like CPU, connectivity, retransmissions, requests and request time.
- Manual configuration of your monitoring setup is no longer necessary.
- Auto-detection starts monitoring new CouchDB databases.

See valuable CouchDB node metrics and find problematic nodes
Valuable CouchDB node metrics for each CouchDB process page are displayed on the CouchDB metrics tab. With the Requests chart, you’ll know how each node is performing. For example, above average Maximum request time measurements may indicate that you have some slow requests.
Identify problematic CouchDB nodes by selecting a relevant time interval on the timeline, select a node metric from the metric drop down list, and compare the values of all nodes in the sortable table.
Additionally, you can check HTTP status codes and metrics.
For the full list of the provided CouchDB metrics please visit our detailed blog post about CouchDB monitoring.
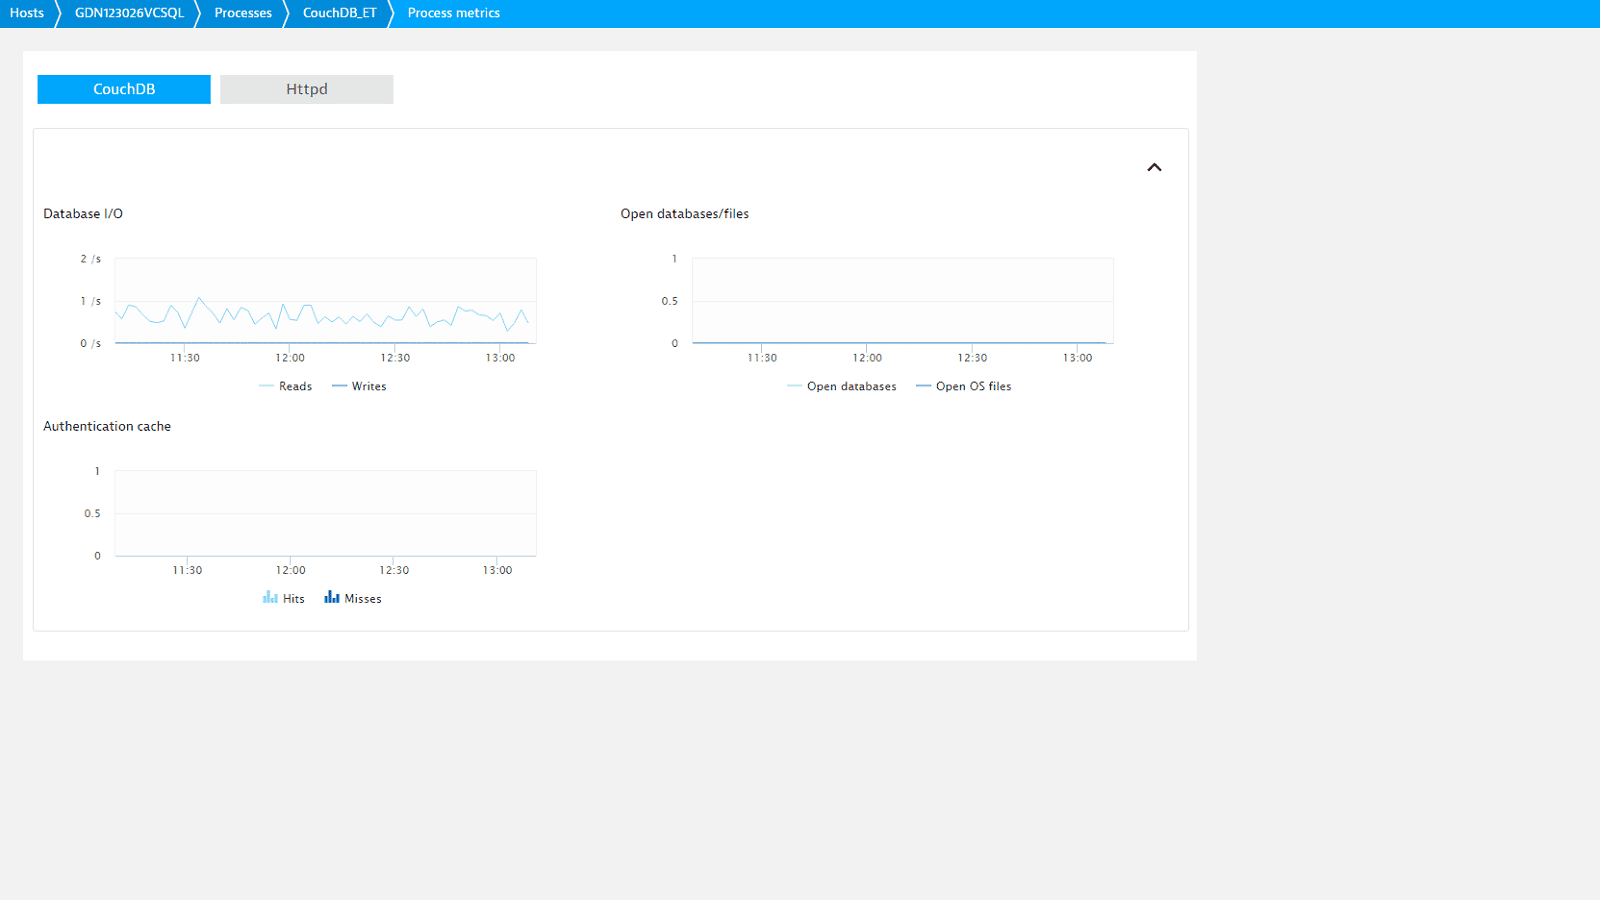
See additional CouchDB node metrics
On the Further details tab Dynatrace shows you 16 additional CouchDB monitoring metrics including:
- Reads
- Writes
- Open databases
- Open OS files
- Hits
- Misses
For the full list of the provided CouchDB node metrics please visit our detailed blog post about CouchDB monitoring.
Enable CouchDB monitoring for a specific host or globally
Dynatrace provides the option of enabling CouchDB monitoring only for specific hosts or globally.
When enabled globally, Dynatrace automatically collects CouchDB metrics whenever a new host running CouchDB is detected in your environment.
Get a free trial

We’re intrigued by its capability to work almost out of the box as well as being able to monitor system aspects as well as application performance and user experience.at Sofico