Apache Cassandra monitoring
App-centric Apache Cassandra performance monitoring.
What is Apache Cassandra?
Apache Cassandra is a free and open-source distributed database management system designed to handle large amounts of data across many commodity servers, providing high availability with no single point of failure.
Visit our Cassandra performance to learn more about how Dynatrace monitors and analyzes the activity of your Apache Cassandra database services across all platforms, providing visibility down to individual database statements.
Start monitoring your Cassandra databases in under 5 minutes!
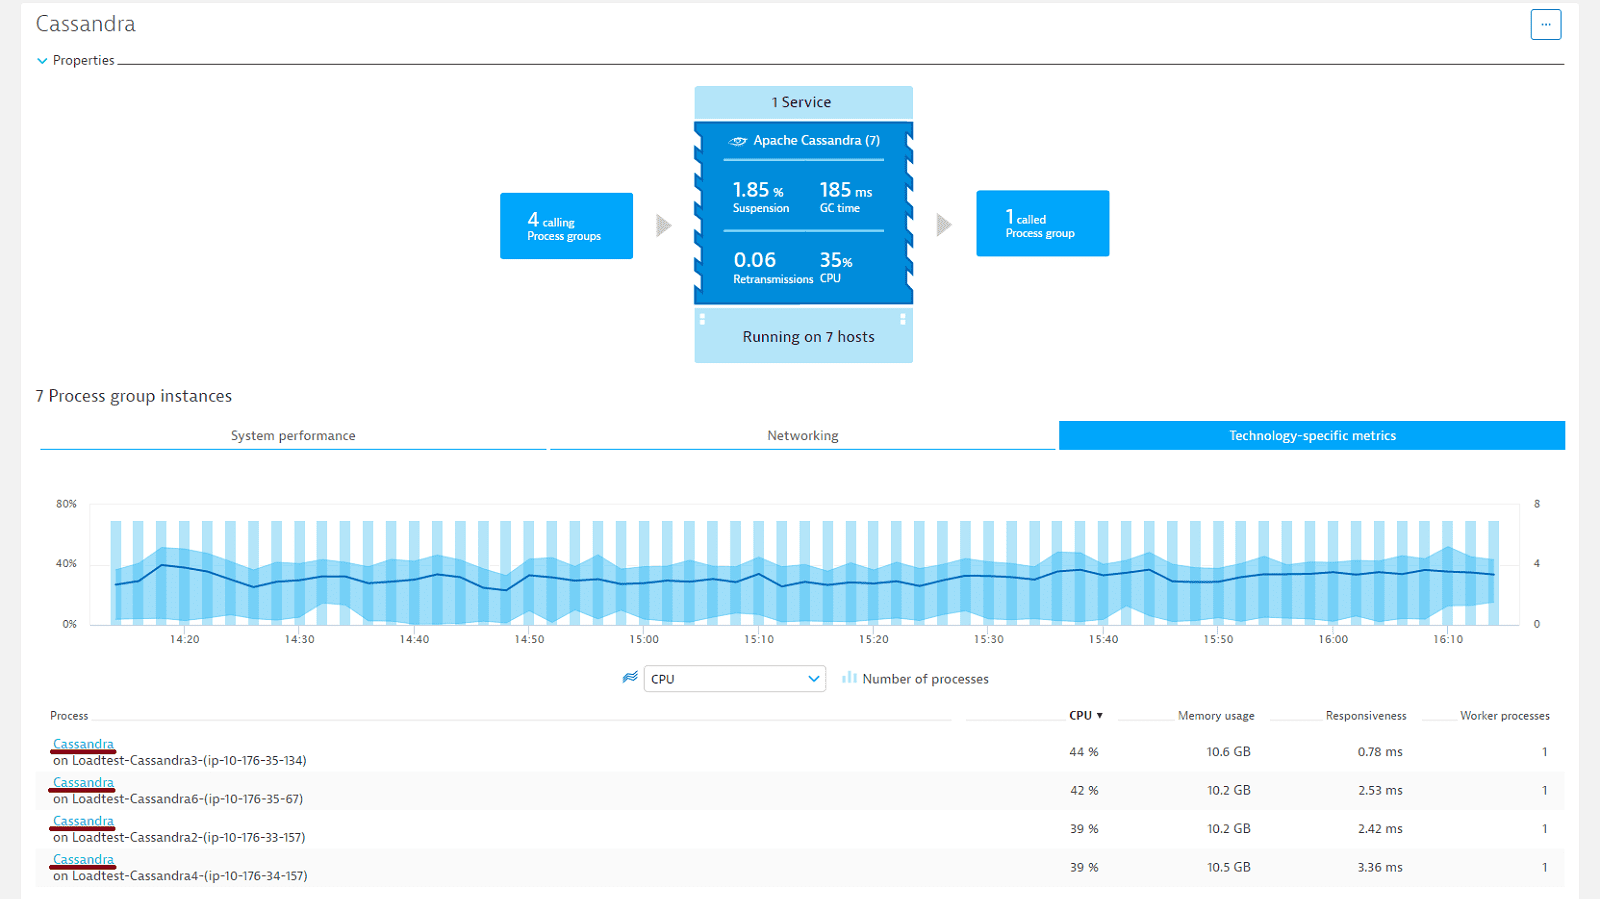
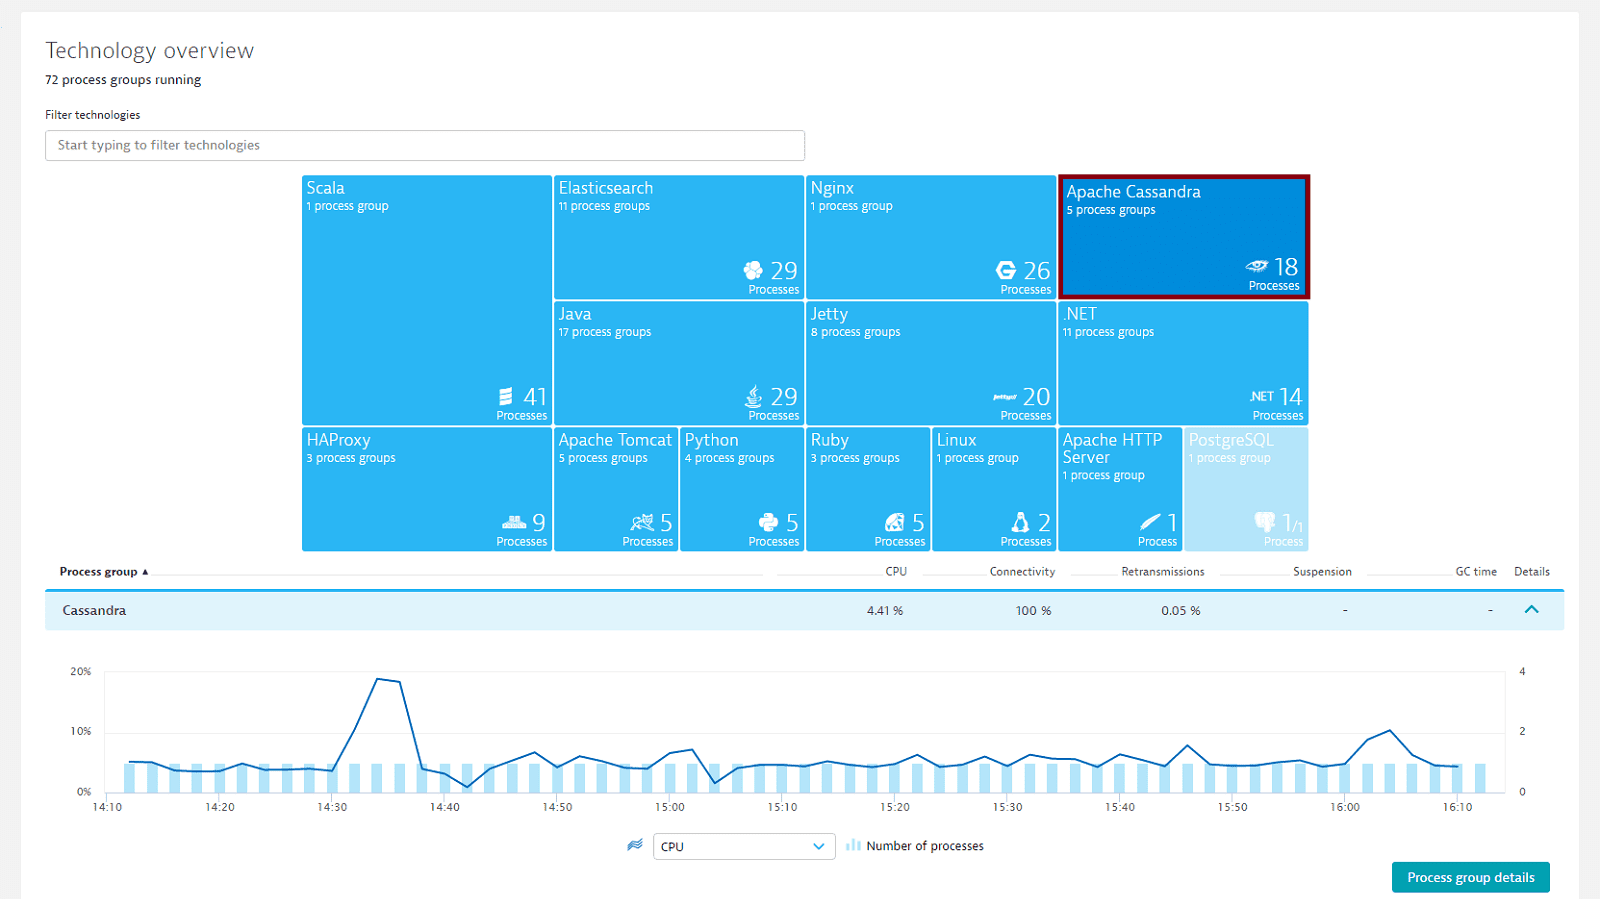
In under five minutes, Dynatrace detects your Cassandra databases and shows metrics like CPU, connectivity, retransmissions, suspension and garbage collection time.
- Manual configuration of your monitoring setup is no longer necessary.
- Auto-detection starts monitoring new Cassandra databases.
See valuable Cassandra node metrics and find problematic nodes
Valuable Cassandra node metrics for each Cassandra process page are displayed on the Cassandra metrics tab.
The Exceptions and Failed requests charts show you if there’s a problem with the node. Pay particular attention to Unavailable Read/Write/RangeSlice counts. Increased latency while the number of operations remains stable typically indicates a performance issue.
For the full list of the provided Cassandra metrics please visit our detailed blog post about Cassandra monitoring.
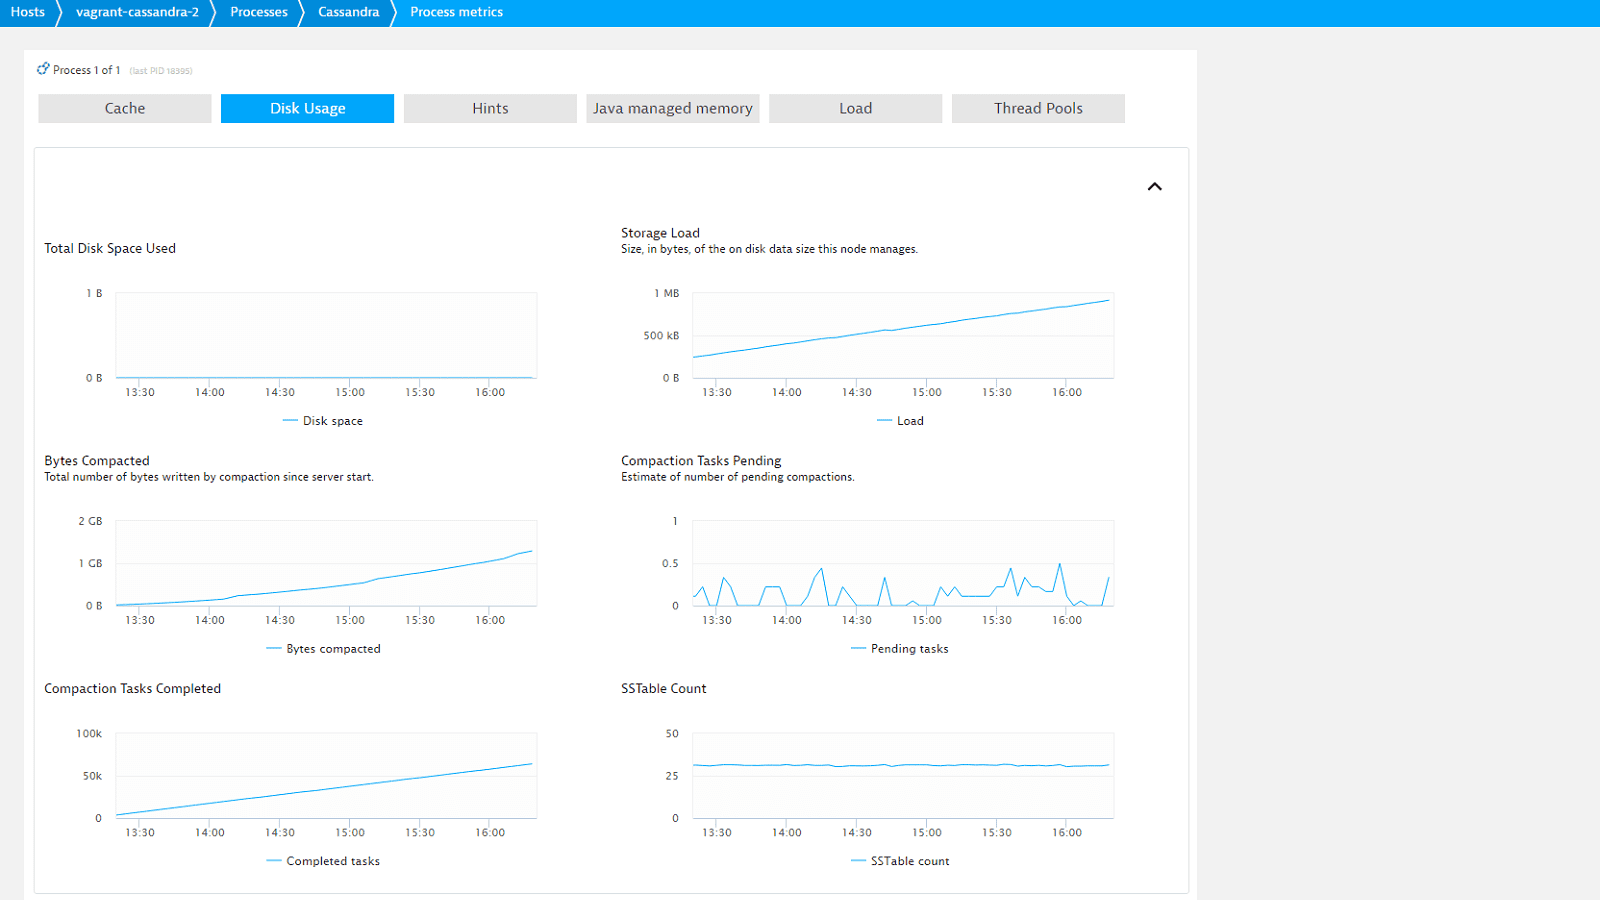
See additional Cassandra node metrics
On the Further details tab Dynatrace shows you additional Cassandra performance metrics related to:
- Cache
- Disk usage
- Hints
- Java managed memory
- Load
- Thread Pools

Get a free trial


