Redis monitoring
Monitor your Redis server performance.
What is Redis?
"Redis" means REmote DIctionary Server. Redis is a data structure server that is open-source, networked, in-memory, and capable of storing keys with optional durability. According to the monthly ranking by DB-Engines.com, Redis is the most popular key-value database. Redis was ranked the #1 NoSQL database (and #4 database) in User Satisfaction and Market Presence based on user reviews, the most popular NoSQL database in containers, and the #1 NoSQL database among Top 50 Developer Tools & Services.
Optimize Redis performance with specific metrics
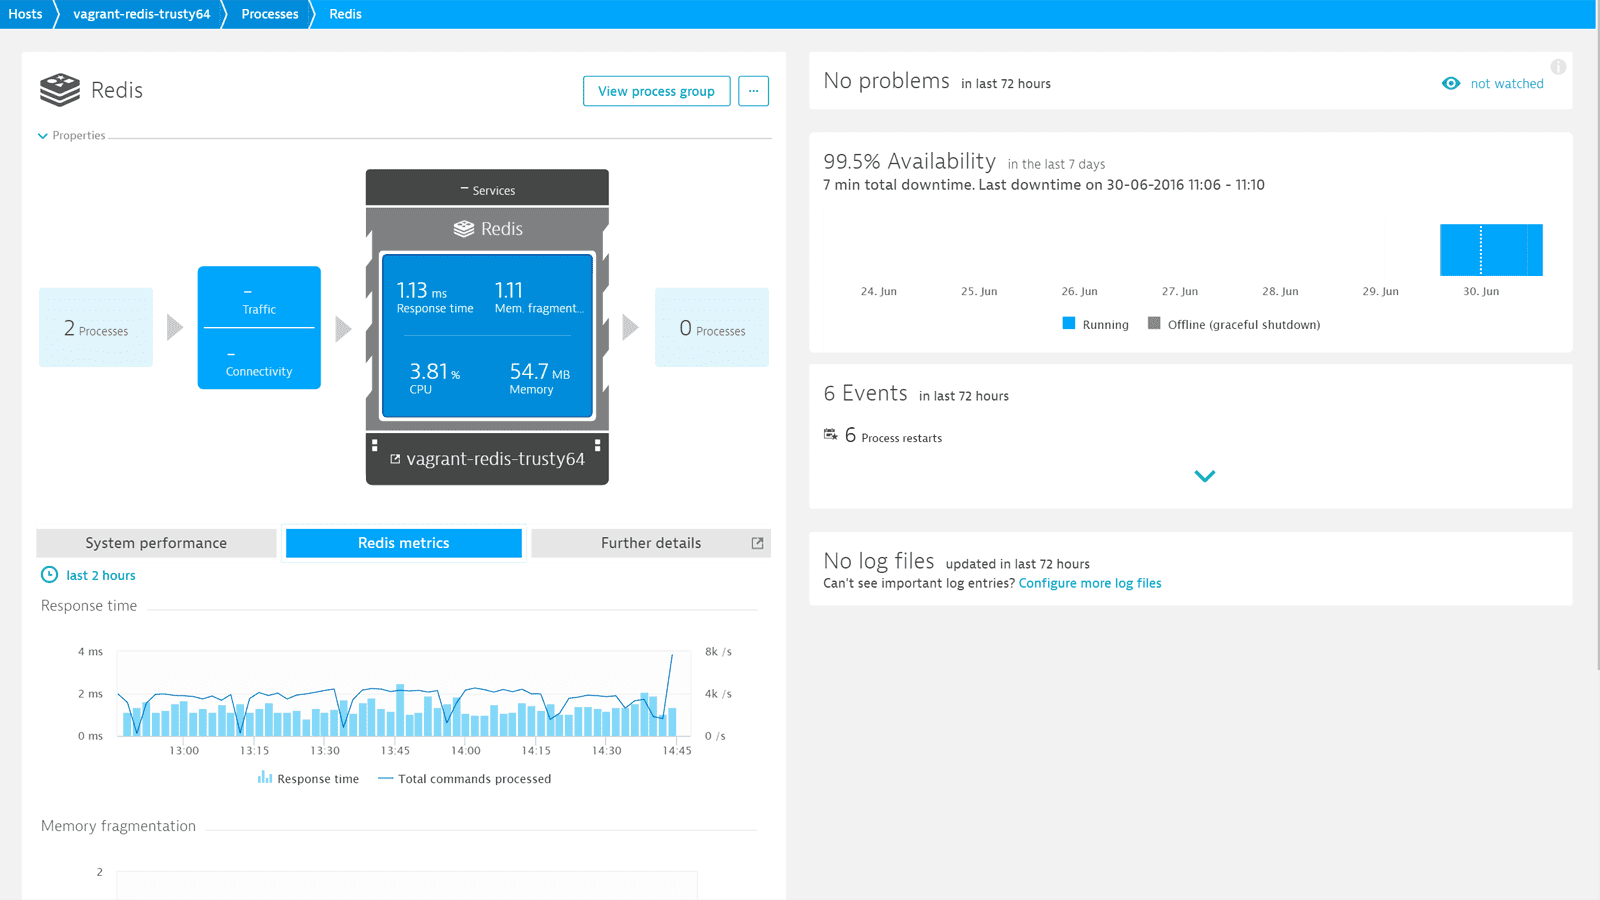
Dynatrace Redis monitoring provides insights into your distributed memory-object caching system, delivering all the metrics you need to see:
- Response time
- Memory fragmentation
- Cache hit ratio
- ...and more
See the full list of Redis performance metrics. System performance metrics (CPU, memory, and more) are available on the System performance tab.
Find slow requests
Dynatrace tracks the queries in your Redis Slow Log—those queries that have exceeded their specified execution times—enabling you to control and optimize your Redis requests.

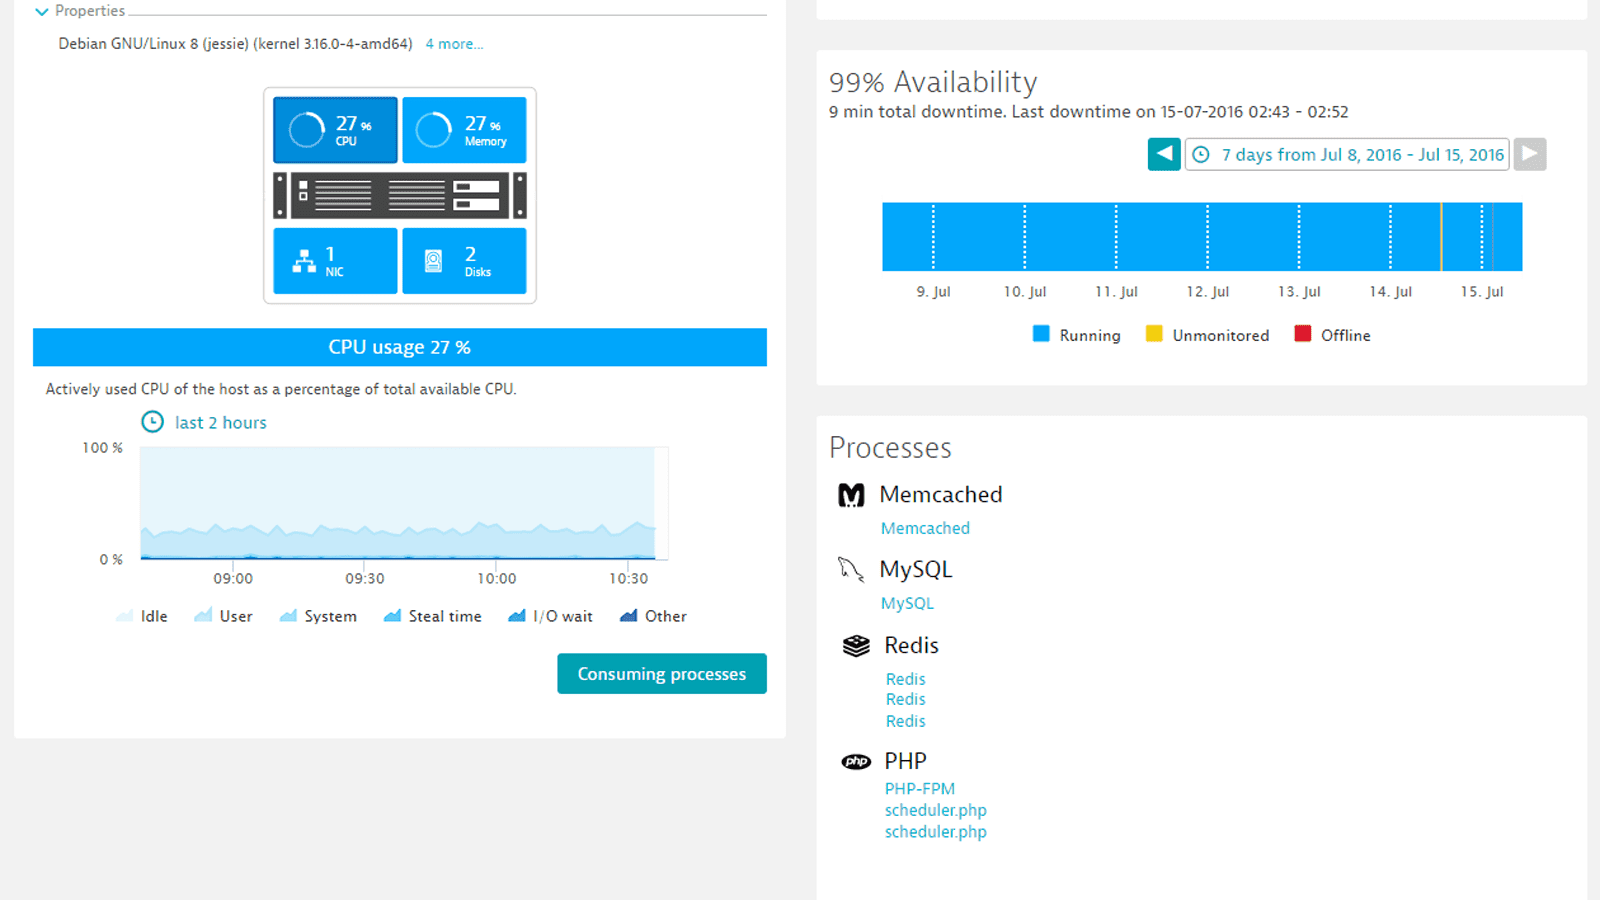
Monitor multiple Redis instances on a single host
Dynatrace automatically discovers your Redis topology. Each Redis instance is viewed as a separate process. With this approach, you get detailed information about each Redis server. Because Redis is single-threaded, and individual Redis instances can only use a single CPU core, it's recommended that you run multiple Redis instances.
Start Redis performance monitoring in under 5 minutes with our free trial!


