PostgreSQL monitoring
App-centric PostgreSQL performance monitoring.
What is PostgreSQL?
PostgreSQL is an object-relational database management system (ORDBMS) with an emphasis on extensibility and standards-compliance. It can handle workloads ranging from small single-machine applications to large Internet-facing applications with numerous concurrent users.
PostgreSQL, often simply Postgres, is a cross-platform object-relational DBMS that runs on Linux, Windows, and other operating systems. Dynatrace monitors PostgreSQL databases across all platforms and analyzes the activity of your database services, providing visibility down to individual PostgreSQL commands.
Easily optimize PostgreSQL performance
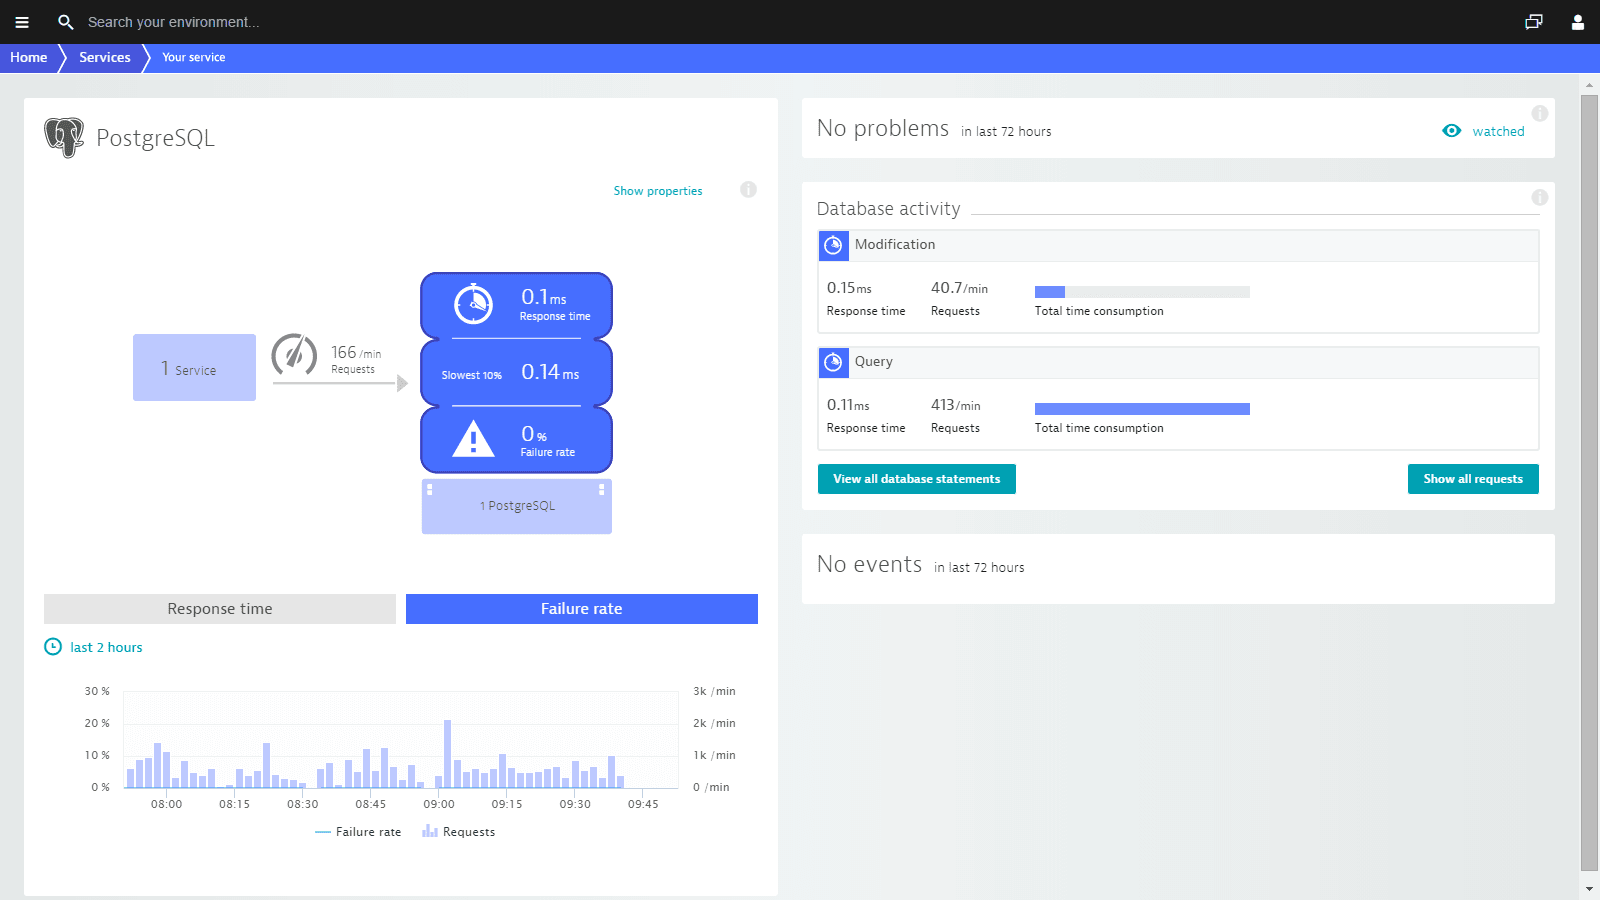
When it comes to analyzing the behavior of PostgreSQL databases, baselining is the approach of choice. By comparing current performance to historical metrics, Dynatrace recognizes when performance is under par. This approach provides you with continuous insights and detailed root-cause analysis when problems occur.
Dynatrace categorizes all activities running on your PostgreSQL instances, providing you with full insight into how your databases are really used. Dynatrace database-service views provide all the metrics you need to set up high-performance database services.
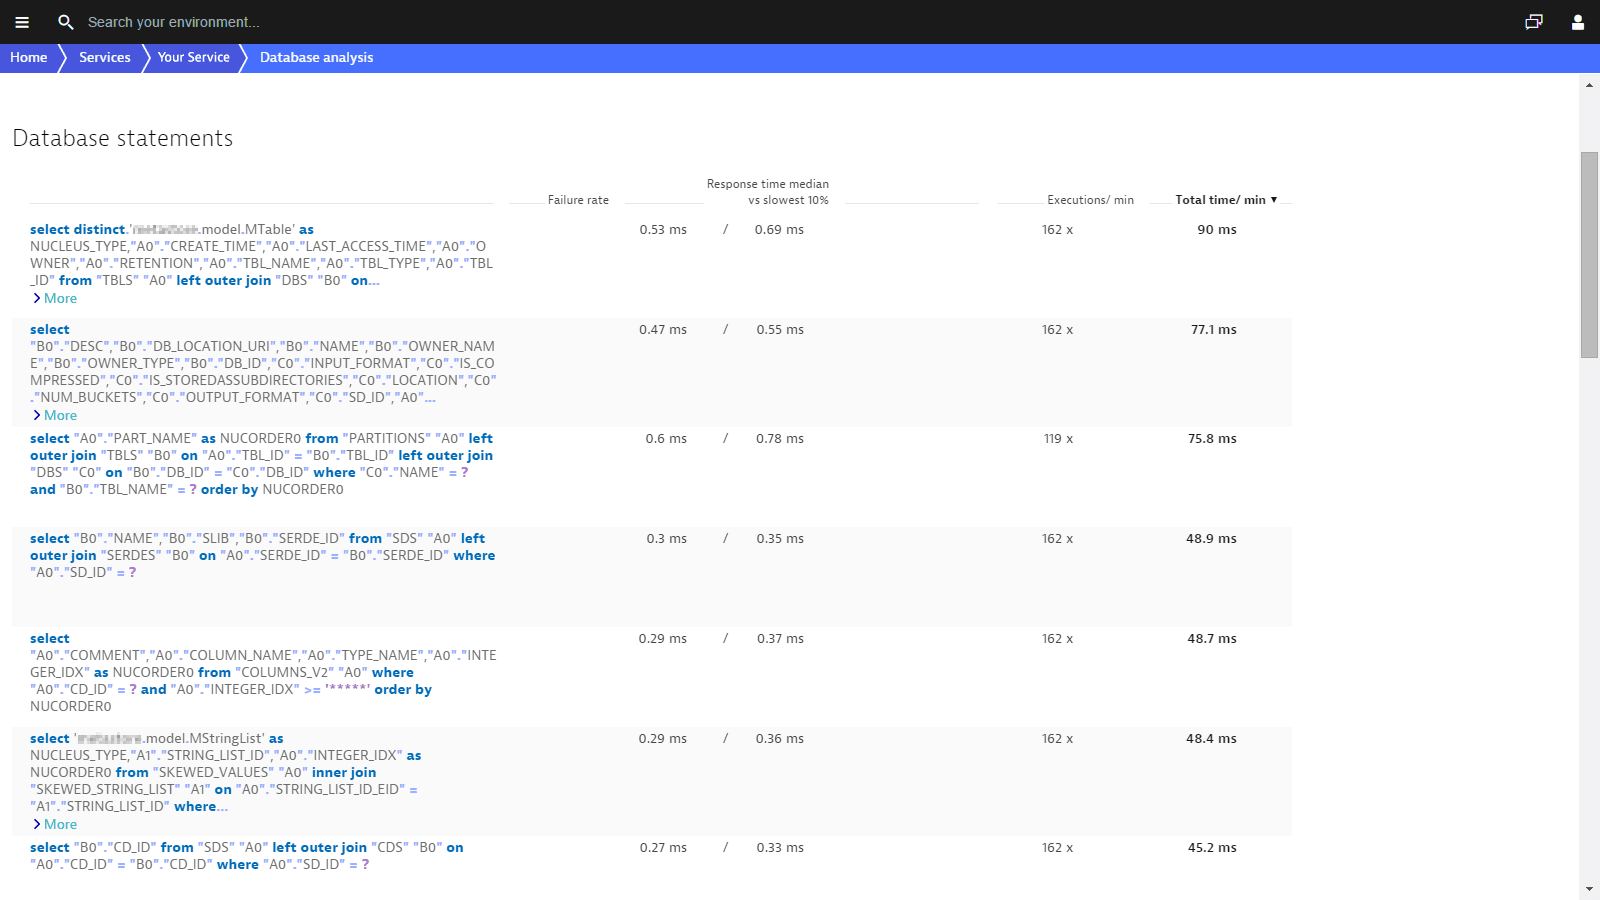
Analyze PostgreSQL performance metrics of each statement
Dynatrace monitors PostgreSQL metrics from your application’s perspective. Because identifying individual non-performing database statements can be time-consuming, Dynatrace automatically identifies expensive database statements (e.g., those that read a lot of data). This approach is ideal for all PostgreSQL database solutions. A complete list of database statements that includes key metrics like response times and numbers of rows is the most valuable information any DevOps team could ask for when optimizing PostgreSQL performance. Take a deep-dive into your database performance!


Dynatrace saves so much time. It's getting easier for all involved people. Now we can share everything with the IT, with specialists, with externals, and with the business.Rene Neubacher Senior IT Business Consultant at Swarovski
Sign up for Dynatrace PostgreSQL monitoring today!


