PHP monitoring
Most powerful monitoring for the world's most popular websites.
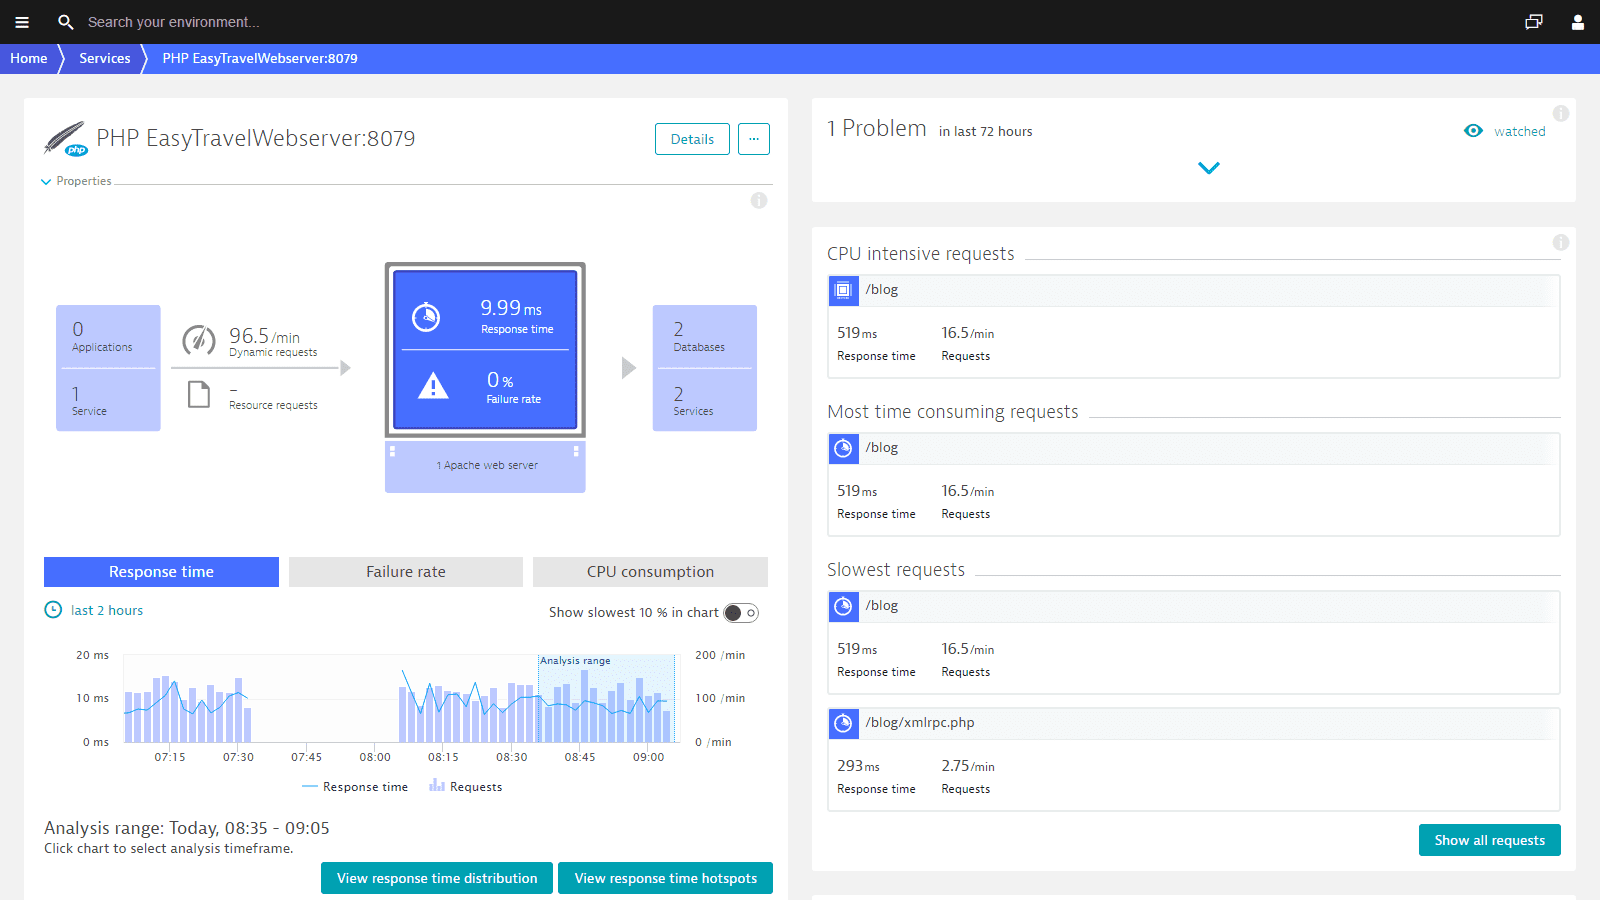
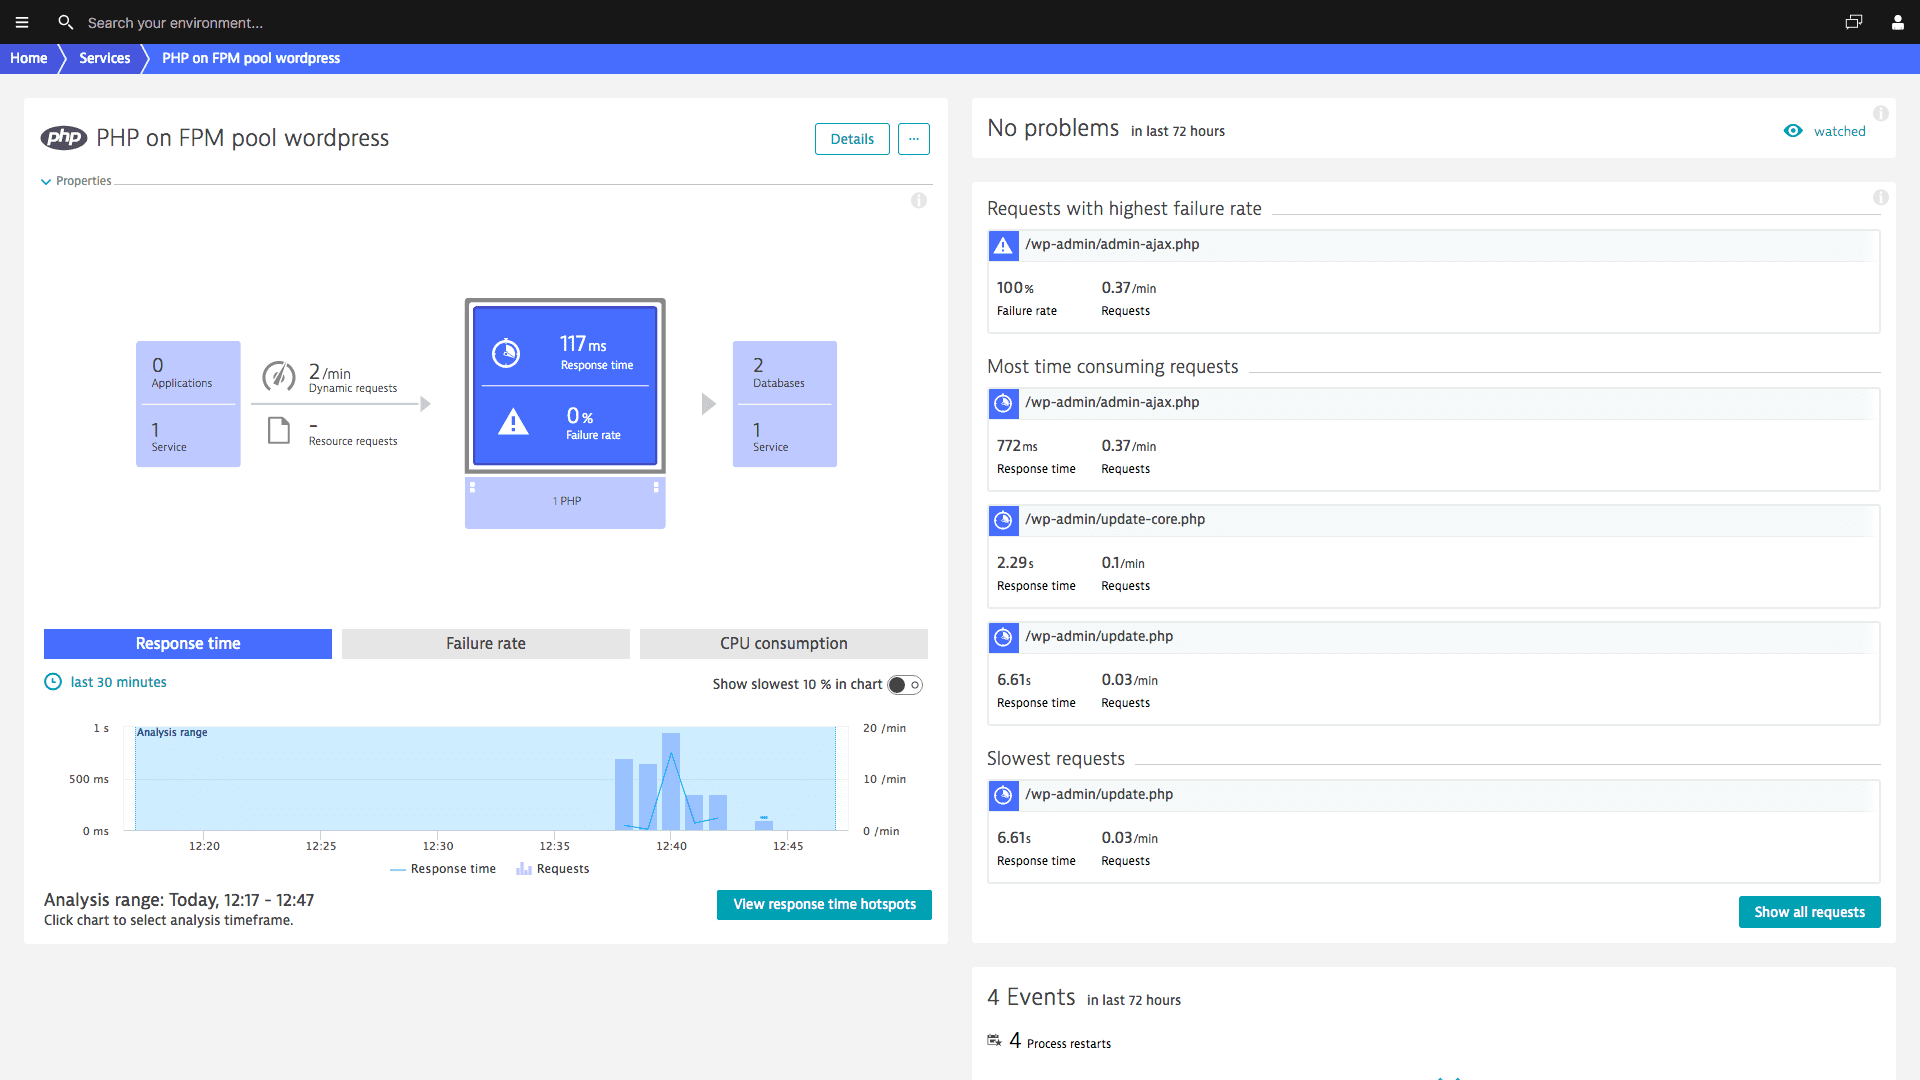
See all PHP performance metrics in real-time
- Dynatrace captures every transaction, across every tier, without gaps or blind spots.
- Pre-configured dashboards provide all relevant metrics down to SQL statement and code level.
- In under five minutes our OneAgent automatically discovers your entire PHP application stack.
- See performance details for PHP-based applications like WordPress, Joomla, Drupal, and Magento.
Get all PHP performance details
- Worker processes
- Compilation time
- Execution time
- All database statements
- All requests, all dependencies
- Response time
- Failure rate
- Throughput
- Request and response sizes
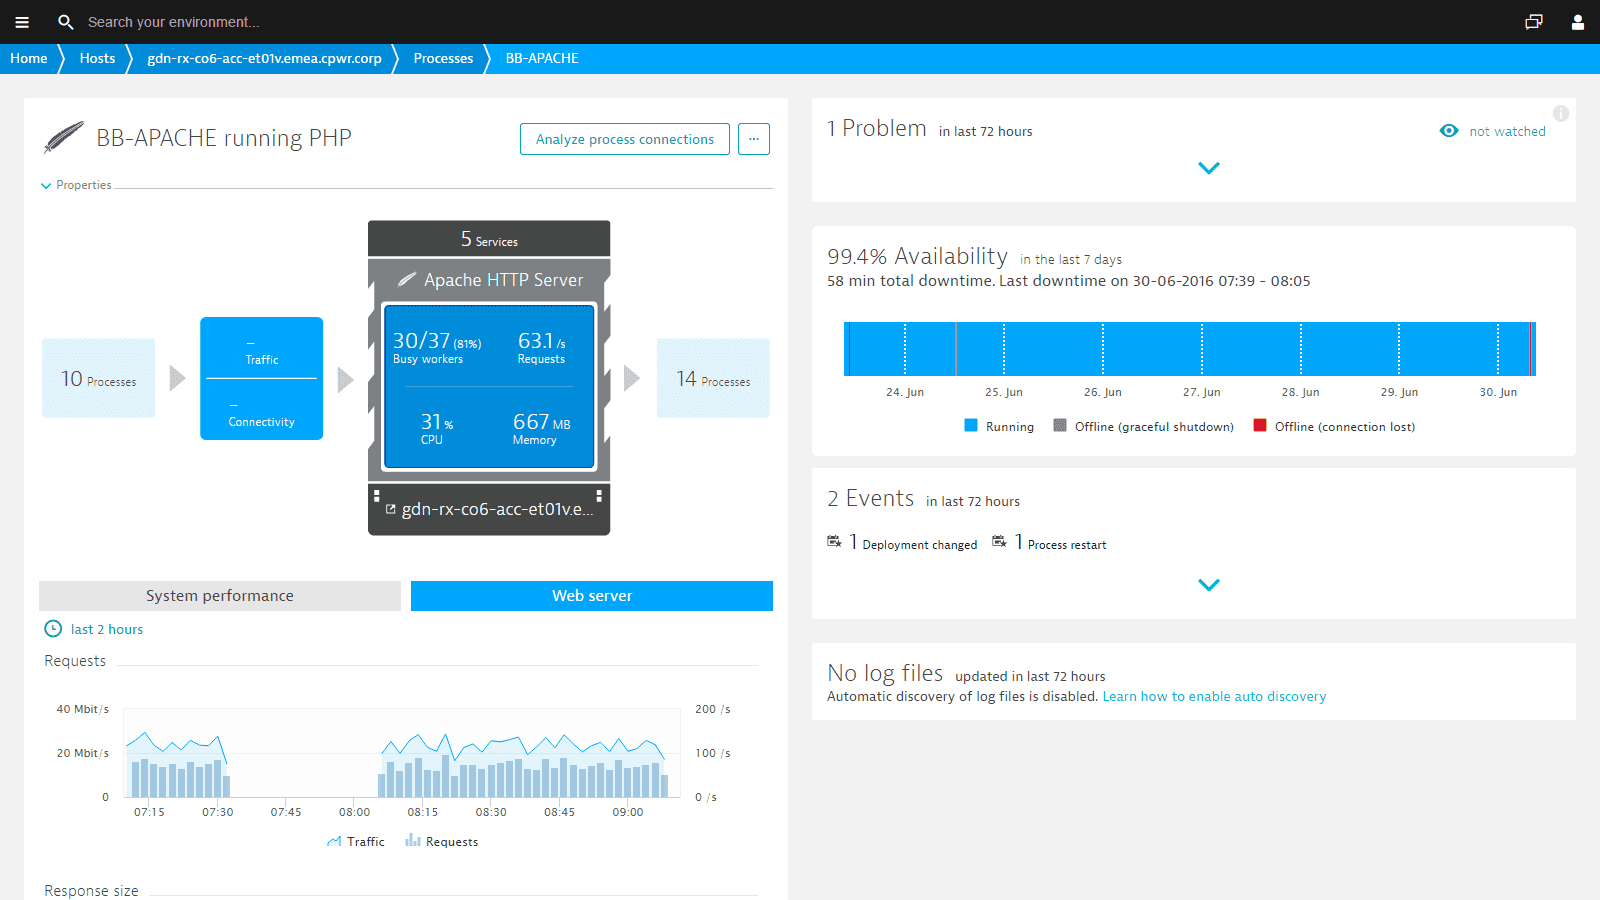
- Restarts, crashes, deployment changes
- Apdex score
- CPU and memory usage
- Garbage collection suspension time
- Network traffic
- TCP requests and retransmissions
Sign up for Dynatrace PHP monitoring today!


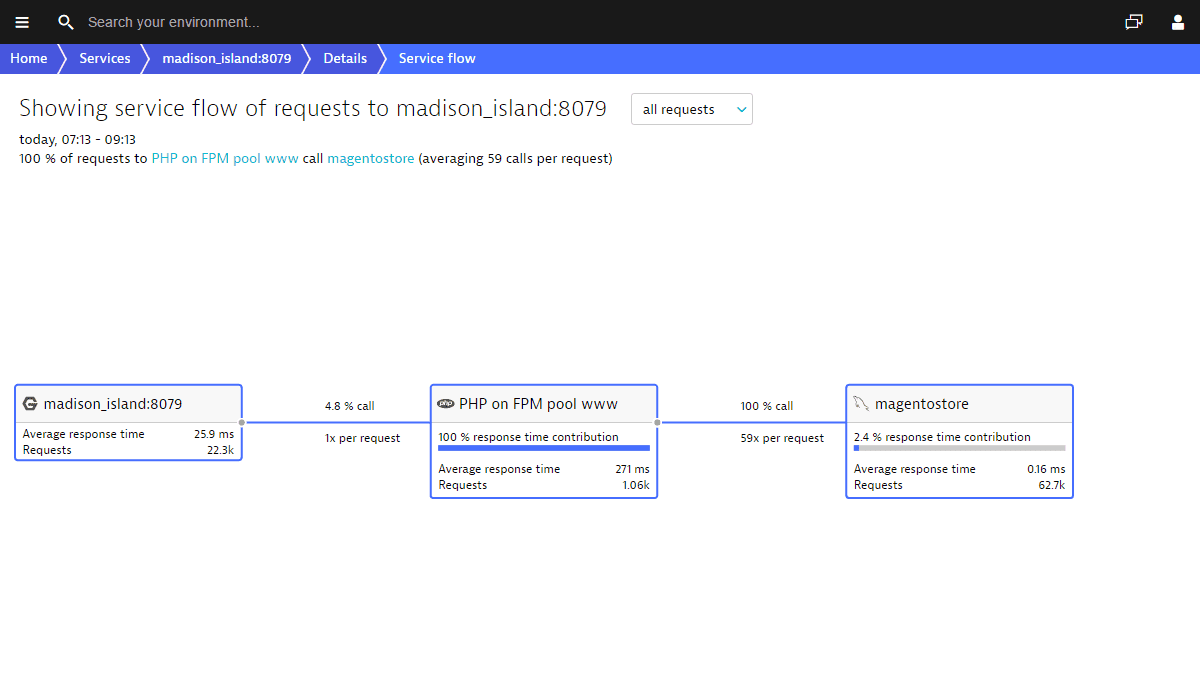
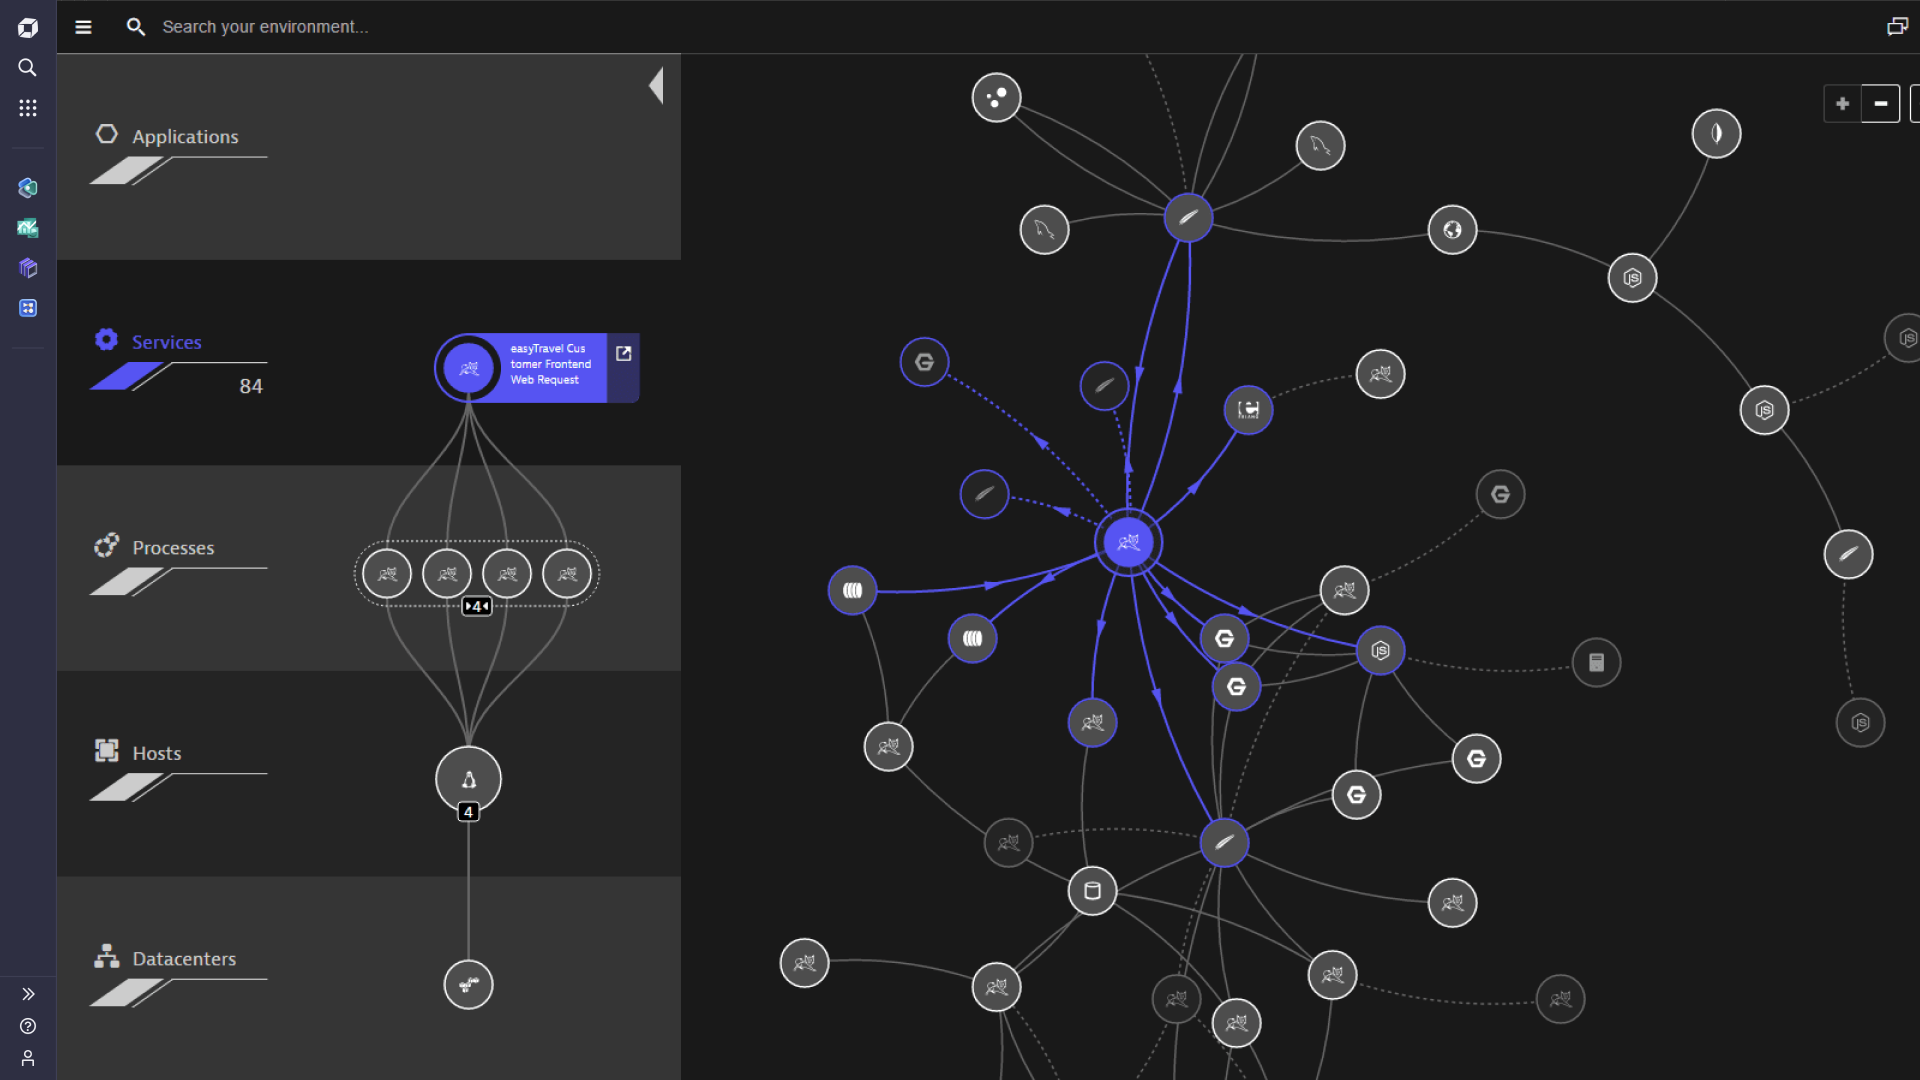
Follow every single transaction, end-to-end
Dynatrace uses patented PurePath Technology® to capture timing and code-level context for every transaction, across every tier, without gaps or blind spots.
- Drill into all services and components called upon a single user interaction.
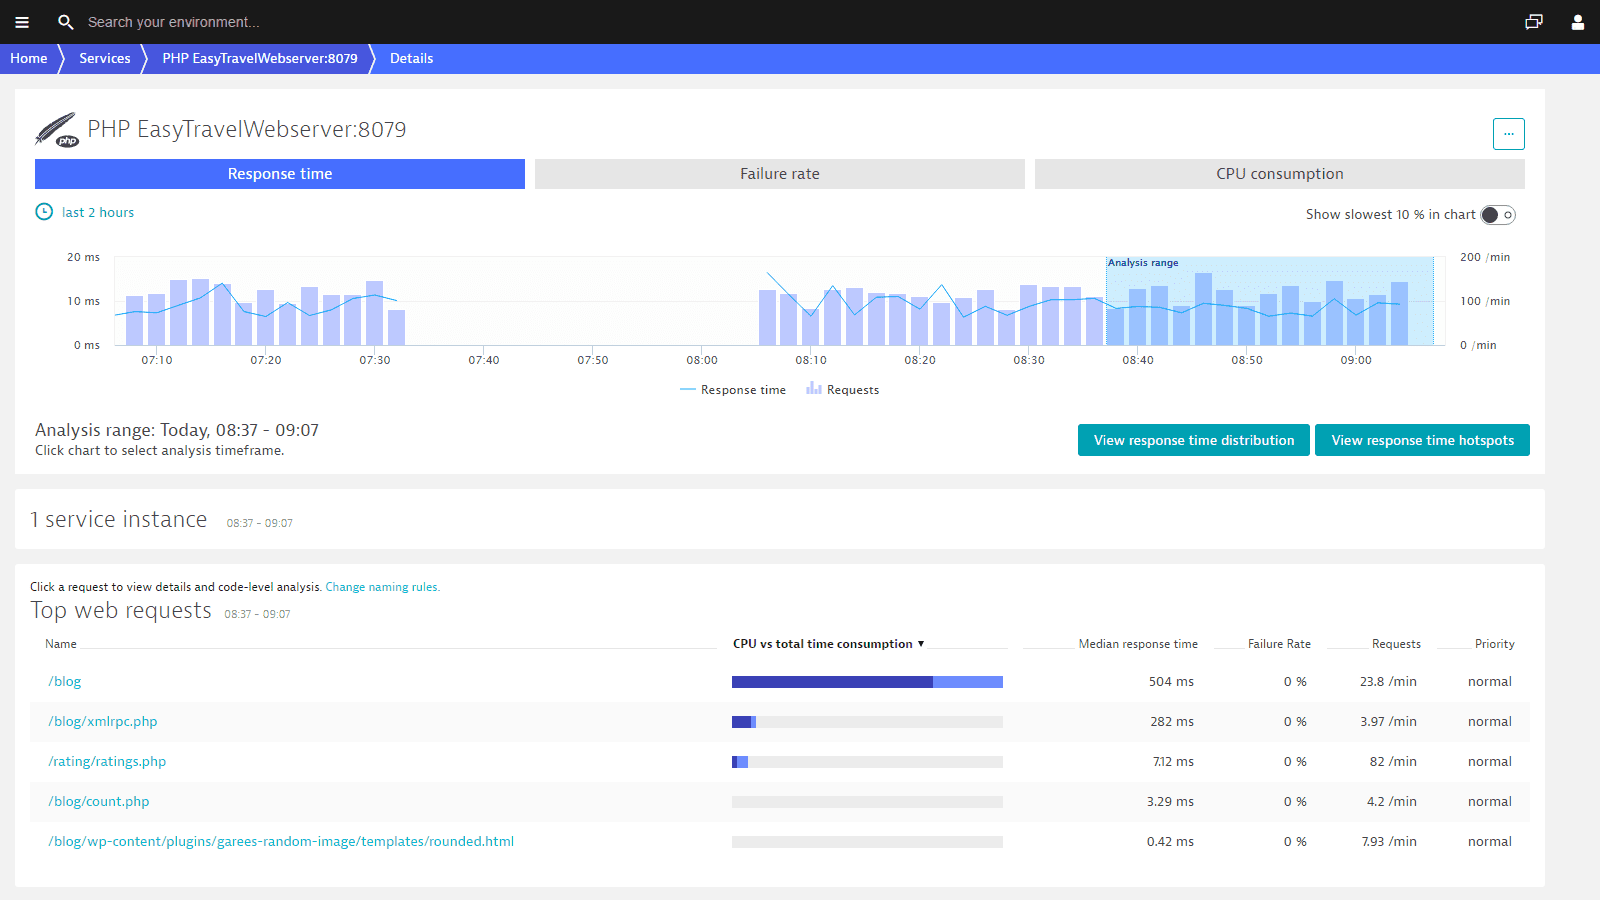
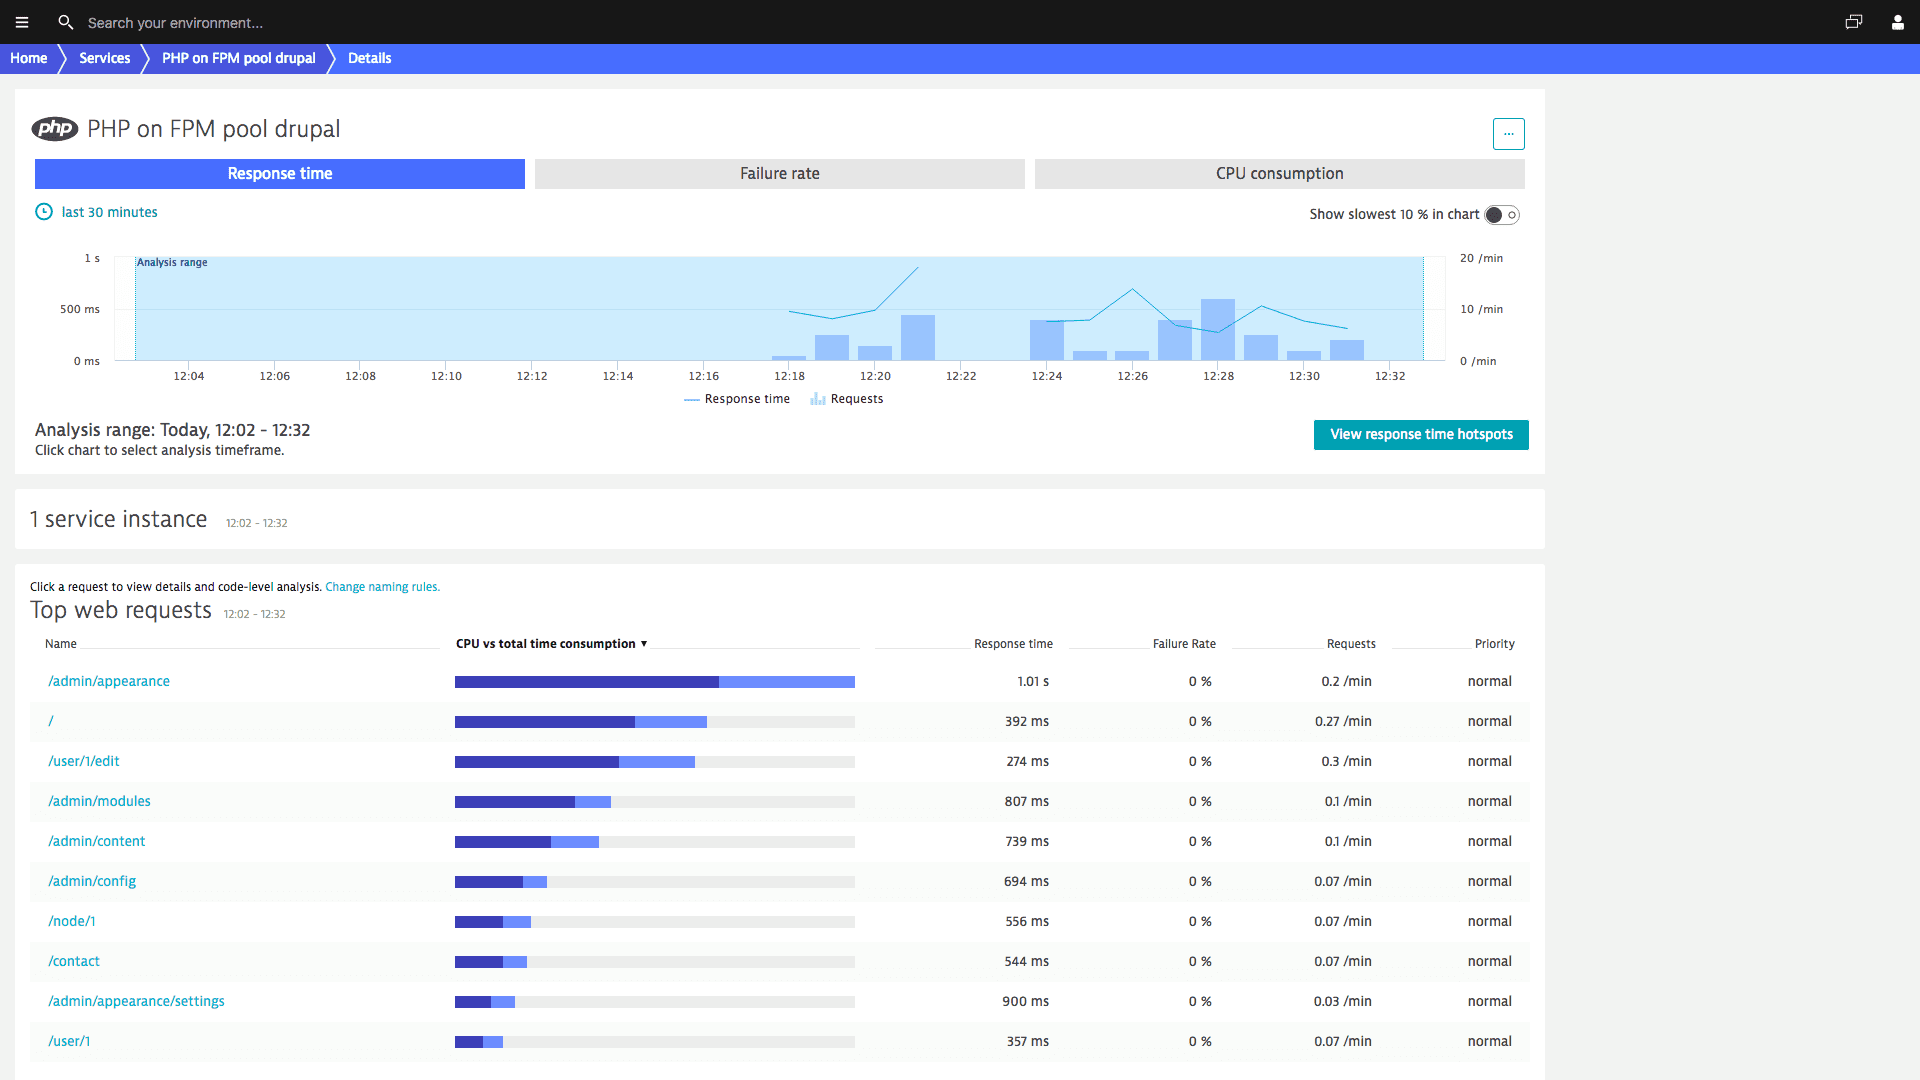
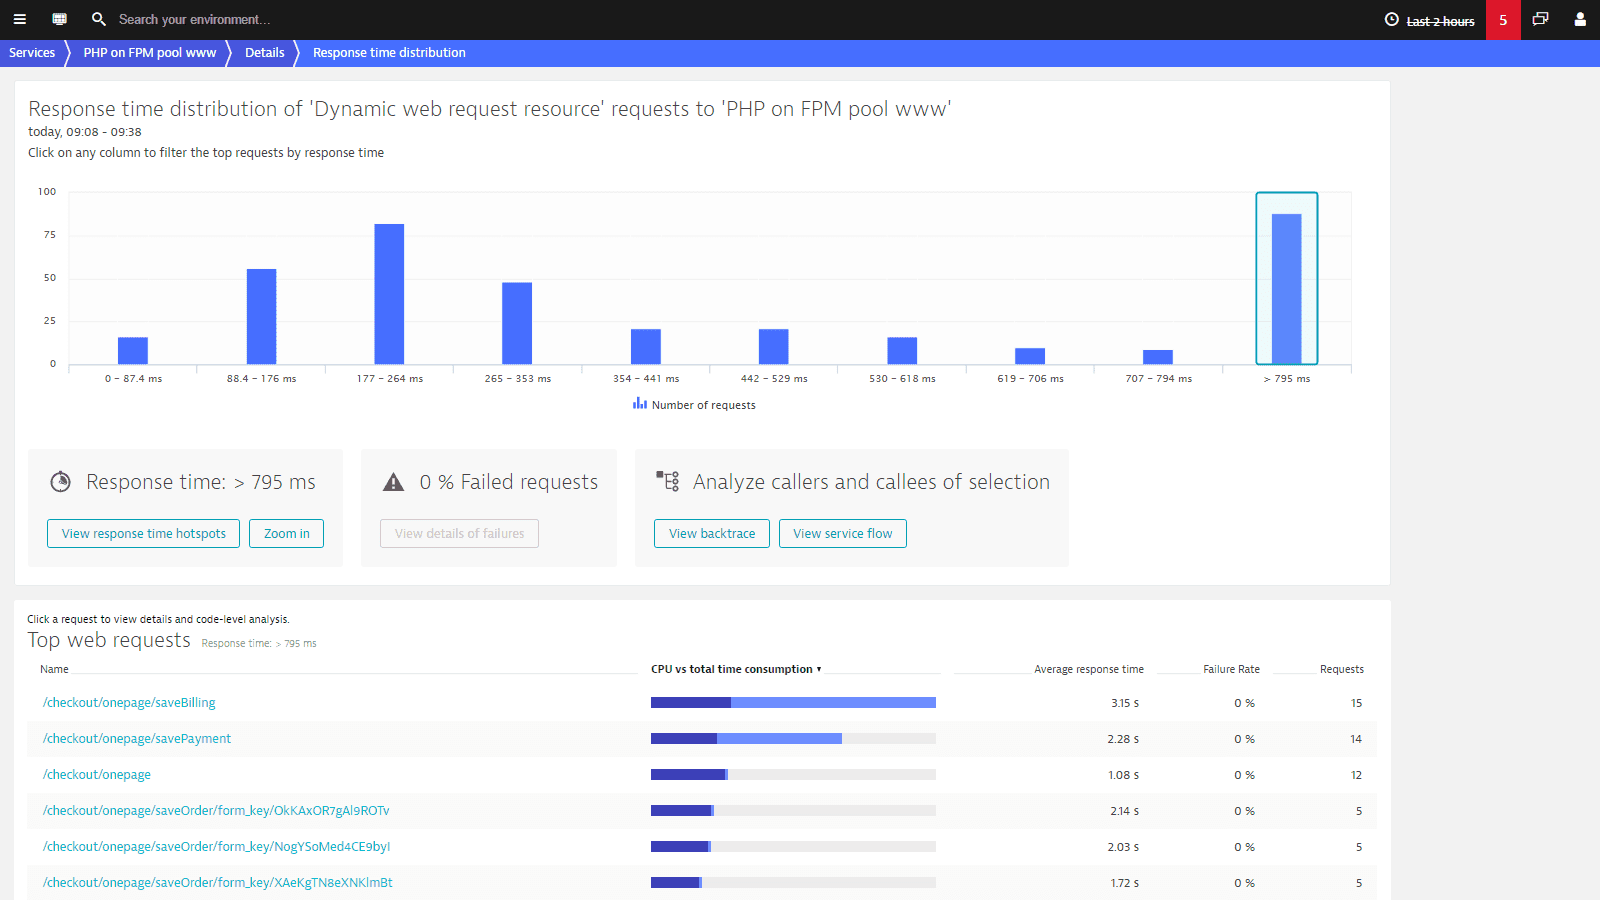
- Analyze response times and find hotspots at the method level.
- Understand the impact of methods and database statements on user experience with our unique backtrace capability.
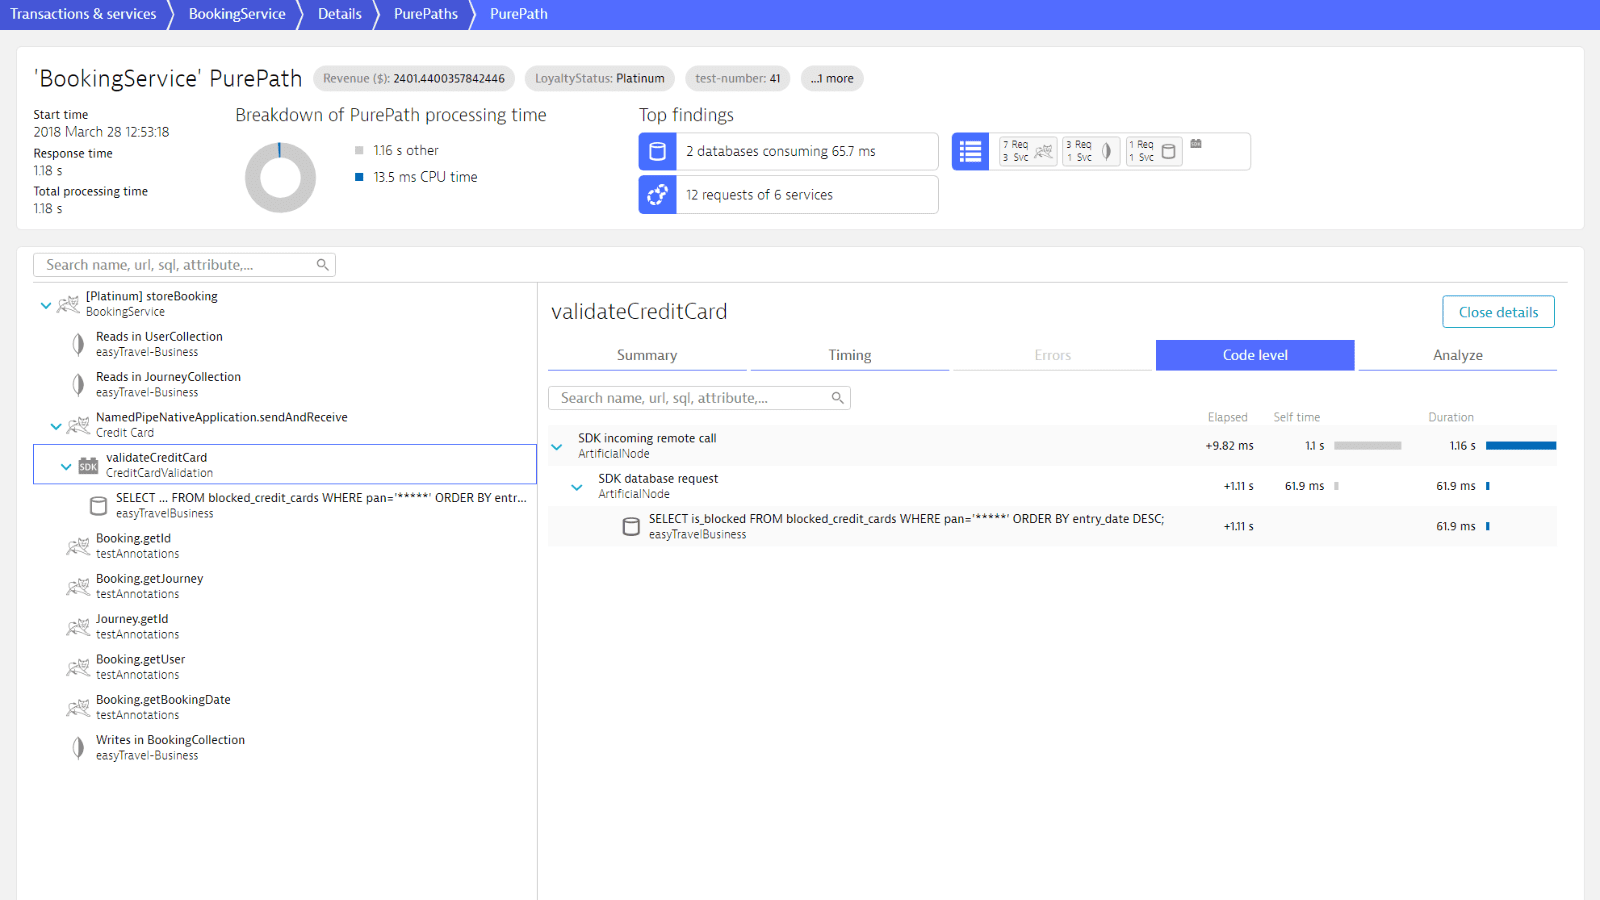


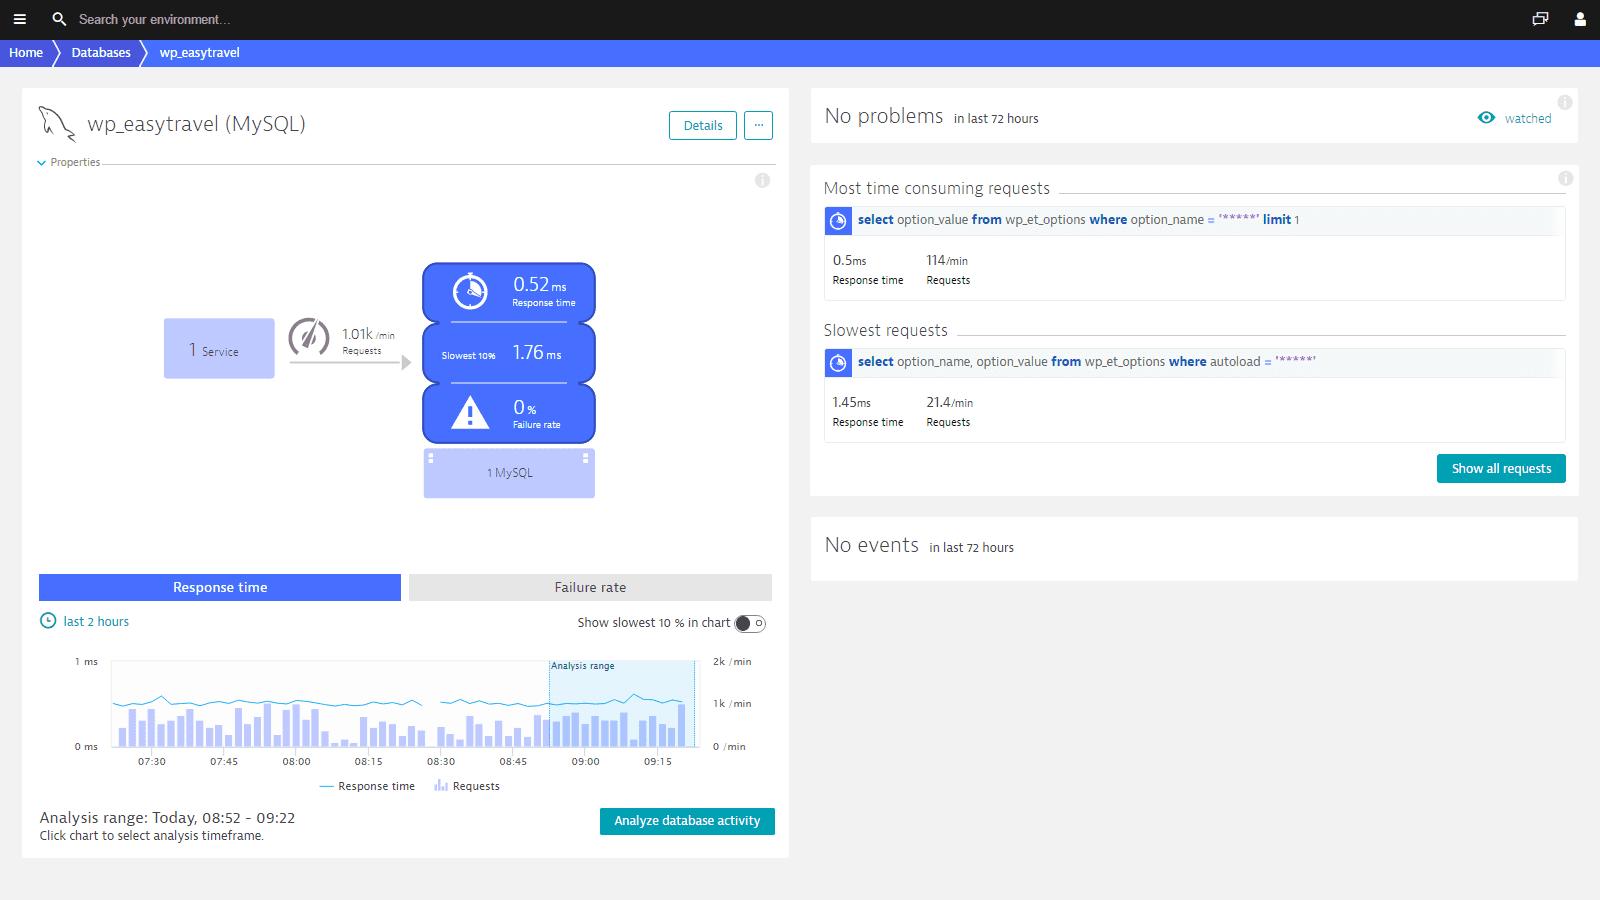
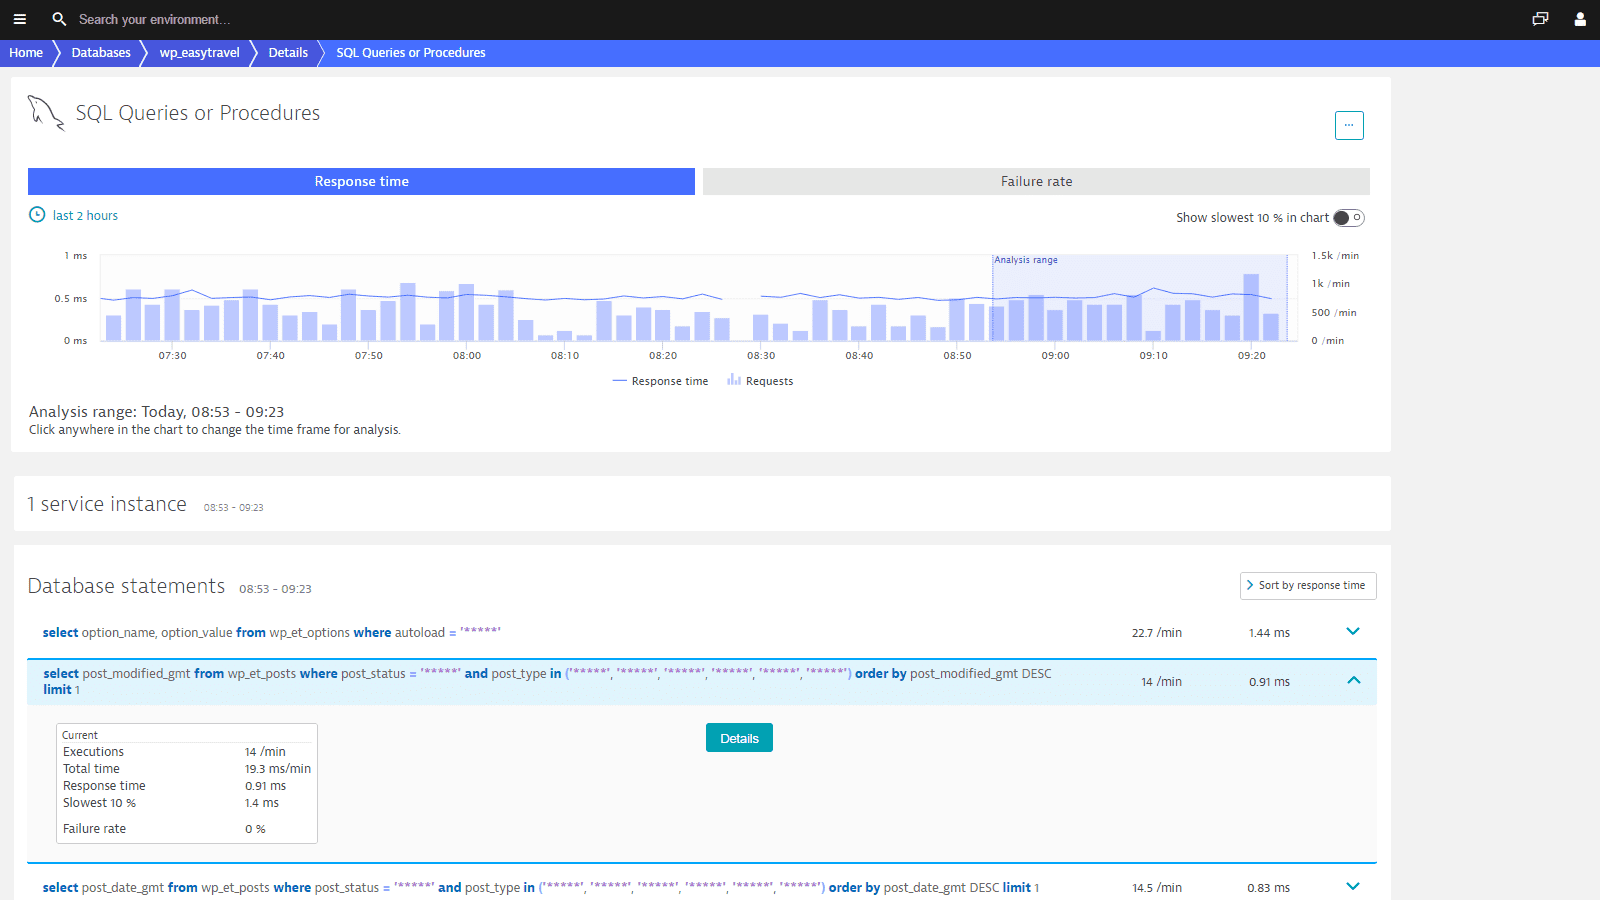
Monitor database query executions
Dynatrace tracks and inspects all SQL statements and NoSQL queries sent by your application. Do you know how well your database statements scale?
Dynatrace displays the characteristics of all PHP database calls, which helps you identify database hotspots. Such insights are a decisive advantage in optimizing the performance of your website and improving your site rankings.

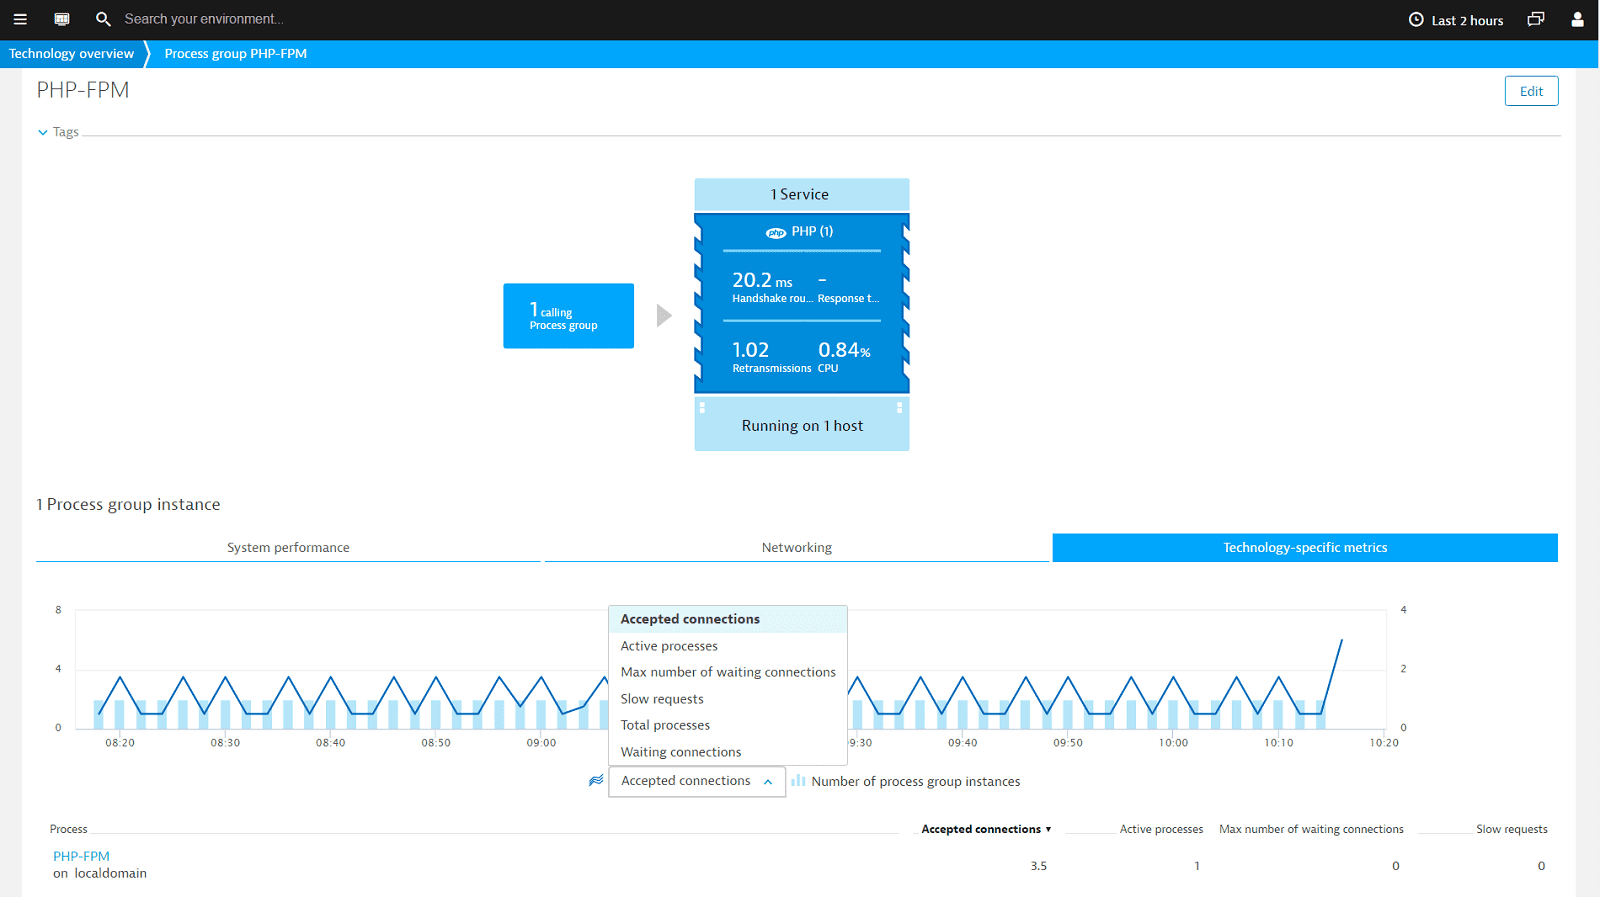
Track your PHP-FPM performance
Dynatrace PHP-FPM integration automatically collects FPM metrics to let you visualize and correlate them with the rest of your applications. You can also set up custom alerts that notify you if there are problems with your FPM instances. Following metrics tell about your FPM instances' health:
- Accepted connections
- Slow requests
- Waiting connections
- Max number of waiting connections
- Active processes
- Total processes
Additional PHP-FPM node monitoring metrics show you charts for Requests, Input buffering, and Processes.
This quick step-by-step guide shows you how to start PHP-FPM monitoring in Dynatrace.
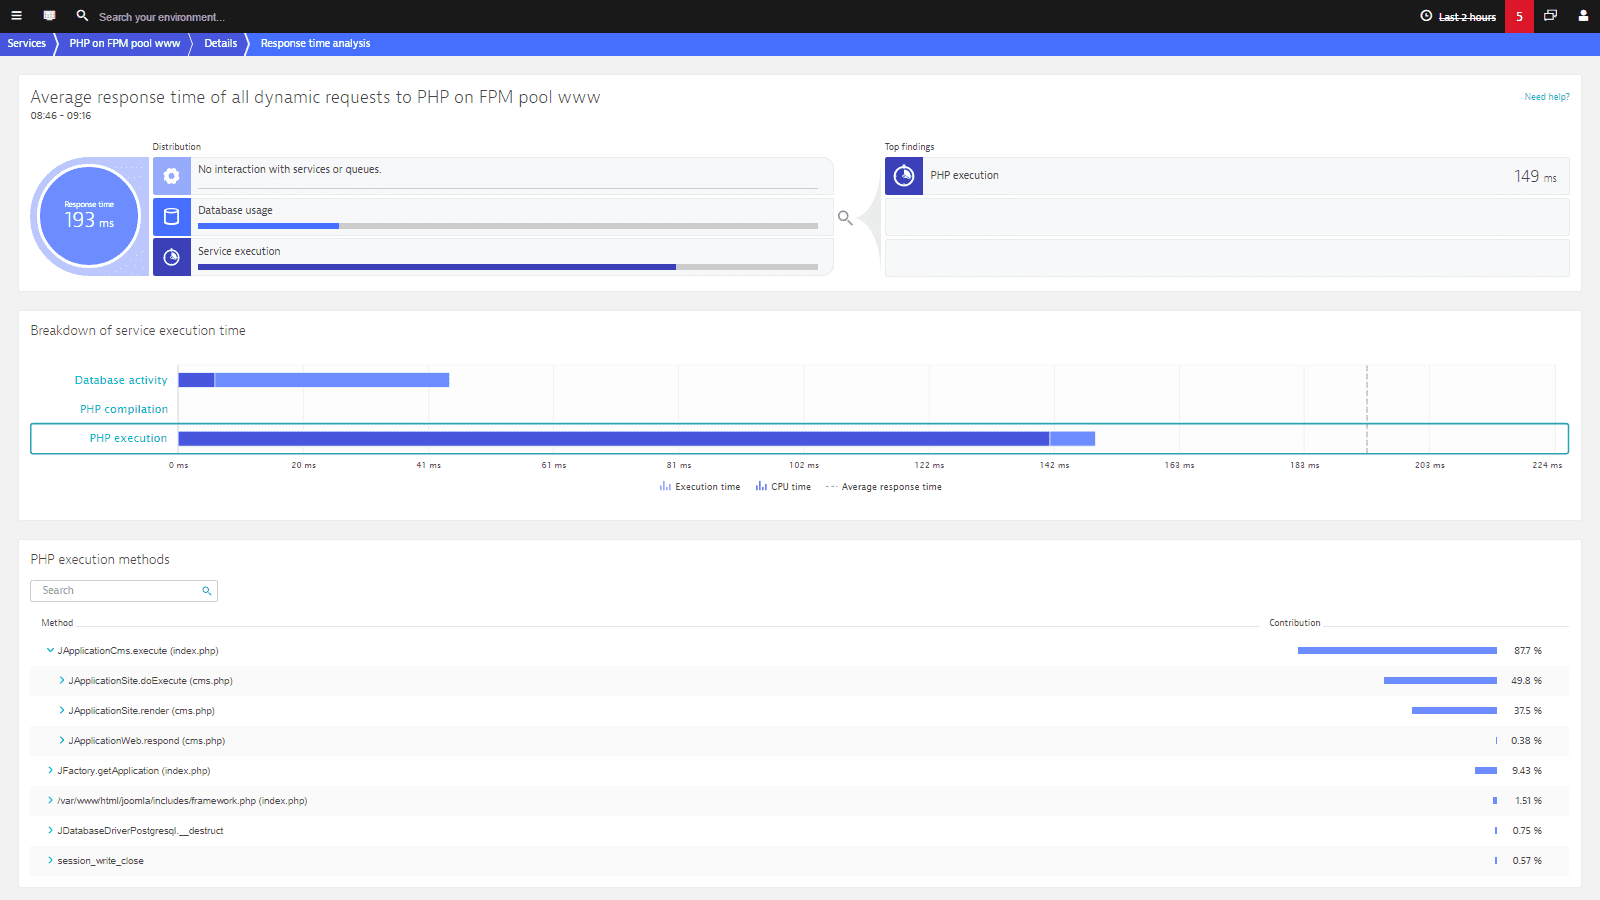
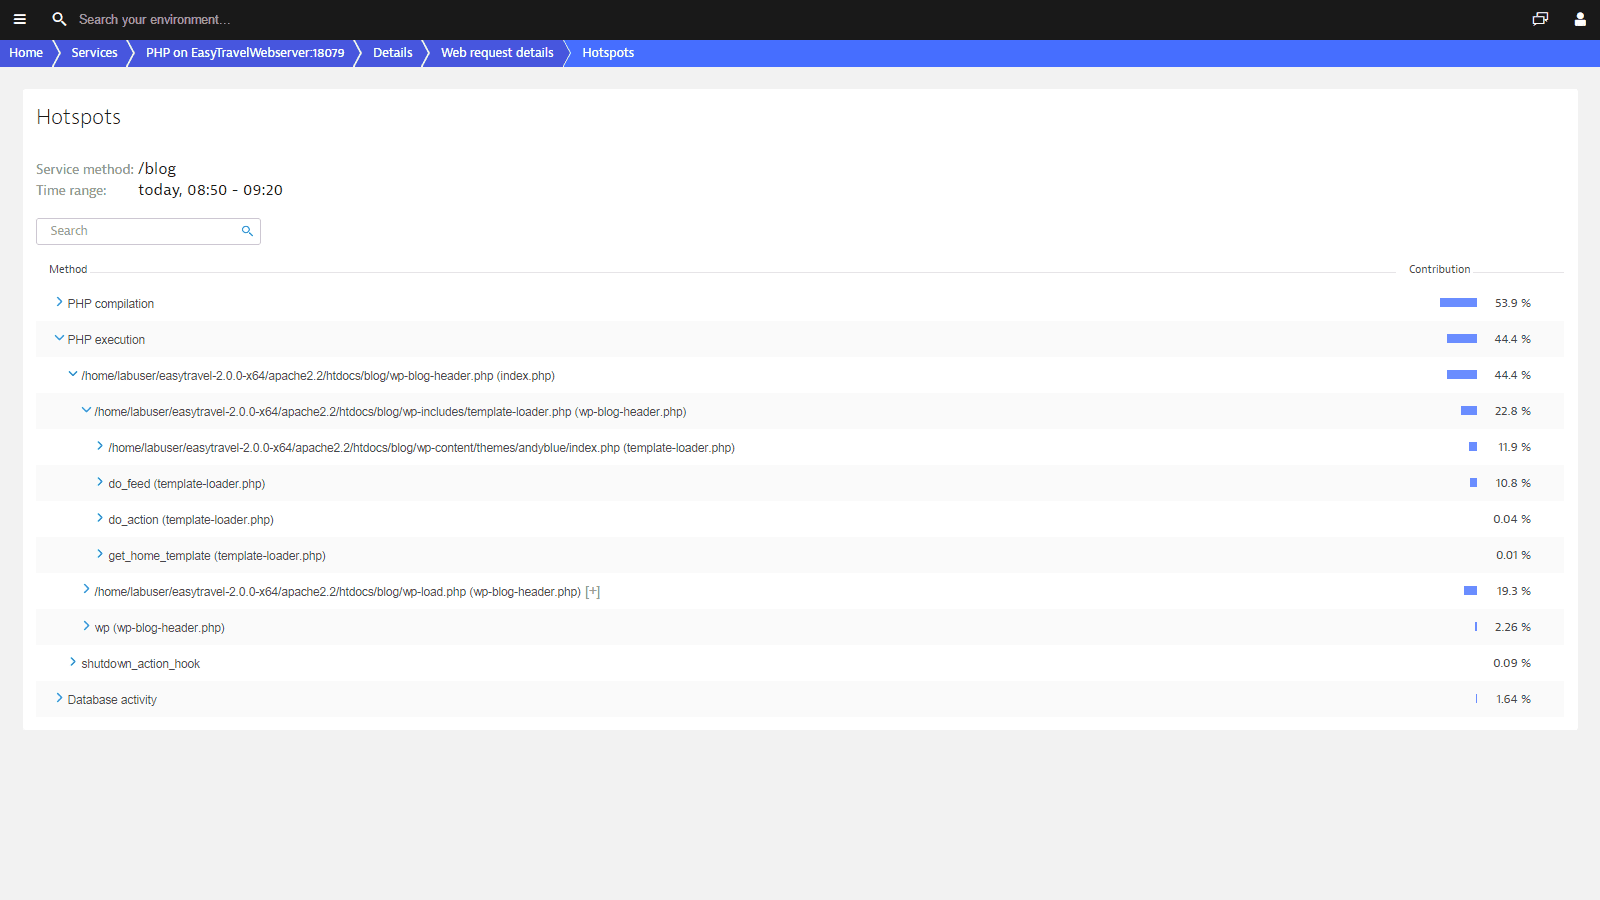
Locate bottlenecks in your application code
Dynatrace enables you to dig into your applications and find hotspots at the code level. Locate problematic methods with CPU or network bottlenecks within the execution call stack.
Your ability to find and resolve PHP performance issues will improve significantly with Dynatrace PHP application monitoring tools.


Dynatrace tells you the root cause of PHP problems!
Dynatrace detects and diagnoses problems in real time, pinpointing the root cause down to the offending code before your customers are even affected.
- Detect availability and performance problems across your stack proactively.
- Dynatrace directly pinpoints components that are causing problems with big data analytics of billions of dependencies within your application stack.
- A visual replay of problem evolution helps you understand how problems evolved over time.

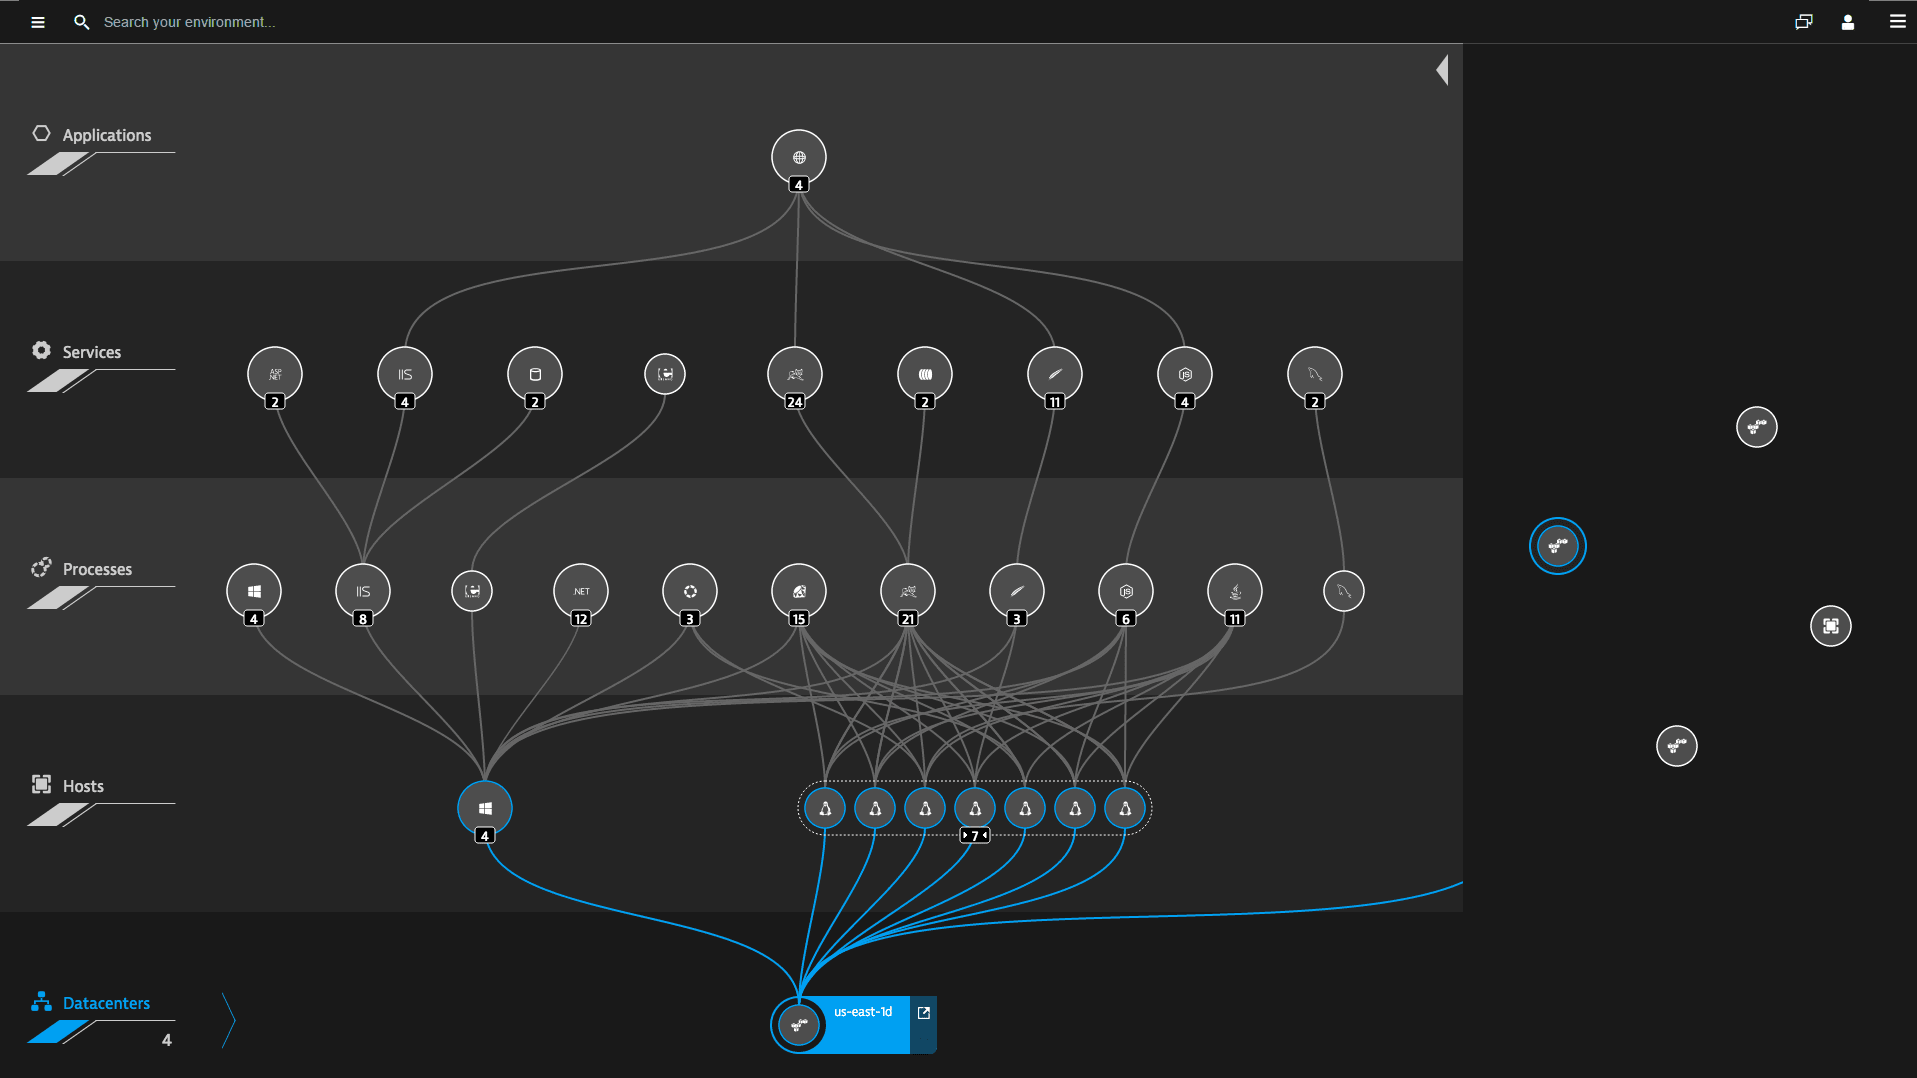

Automatically discover and map applications and infrastructure
Dynatrace automatically detects and visualizes your web application and its dependencies end to end: from website to application to container, infrastructure and cloud.
- Dynatrace Smartscape provides an interactive map of your application across all layers.
- See how all components relate to and communicate with one another.
- Our unique solution was designed for cloud environments where instances are rapidly created and deployed, making it a perfect fit for microservices environments.
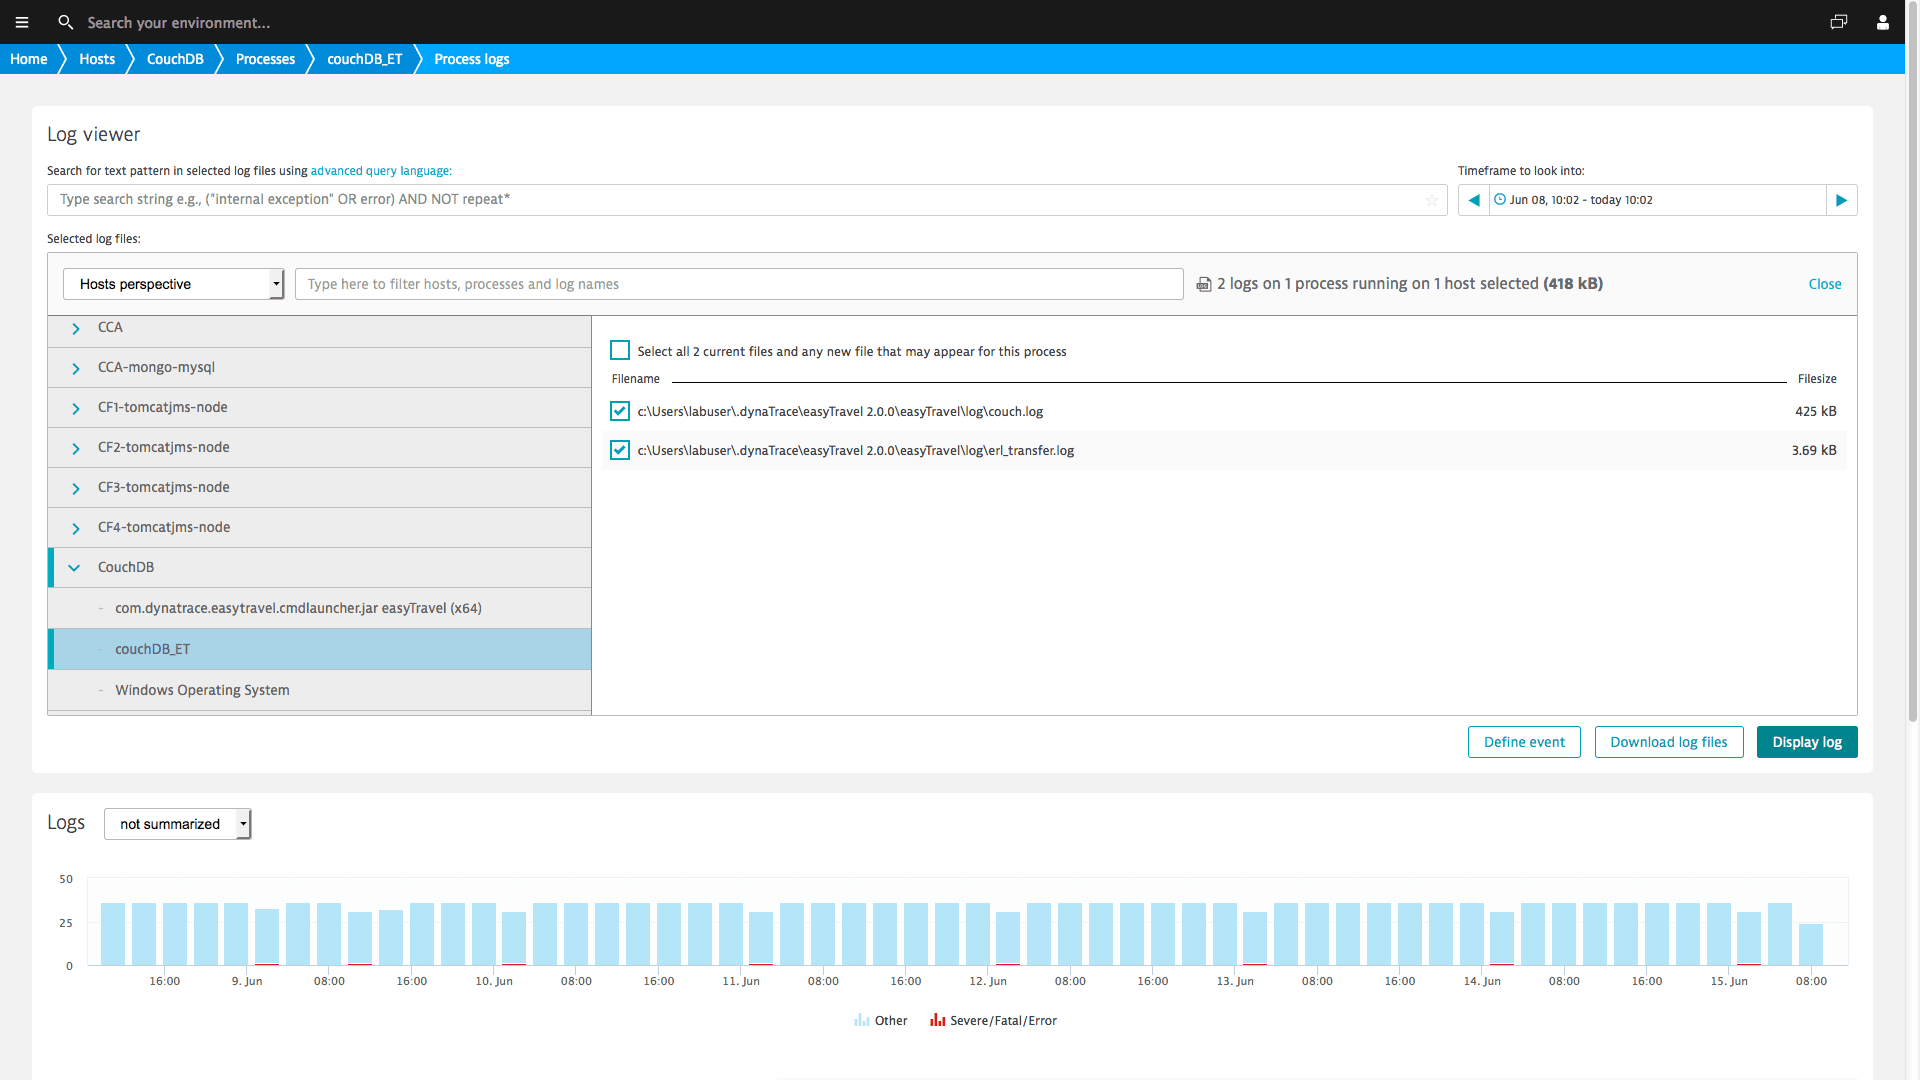
Get the full picture including network health and log file analysis
Dynatrace provides a clear picture of all inbound and outbound process connections over your network interfaces (both physical and virtual) and automatically discovers all log files on your monitored hosts and processes.
- Leverage actual data throughput and quality of network connections between communicating hosts and processes.
- Gain direct access and search the log content of all your system’s mission-critical processes.
- Relevant log messages or networking anomalies are factored into the root-cause analysis of problems.


Dynatrace saves so much time. It's getting easier for all involved people. Now we can share everything with the IT, with specialists, with externals, and with the business.Rene Neubacher Senior IT Business Consultant at Swarovski
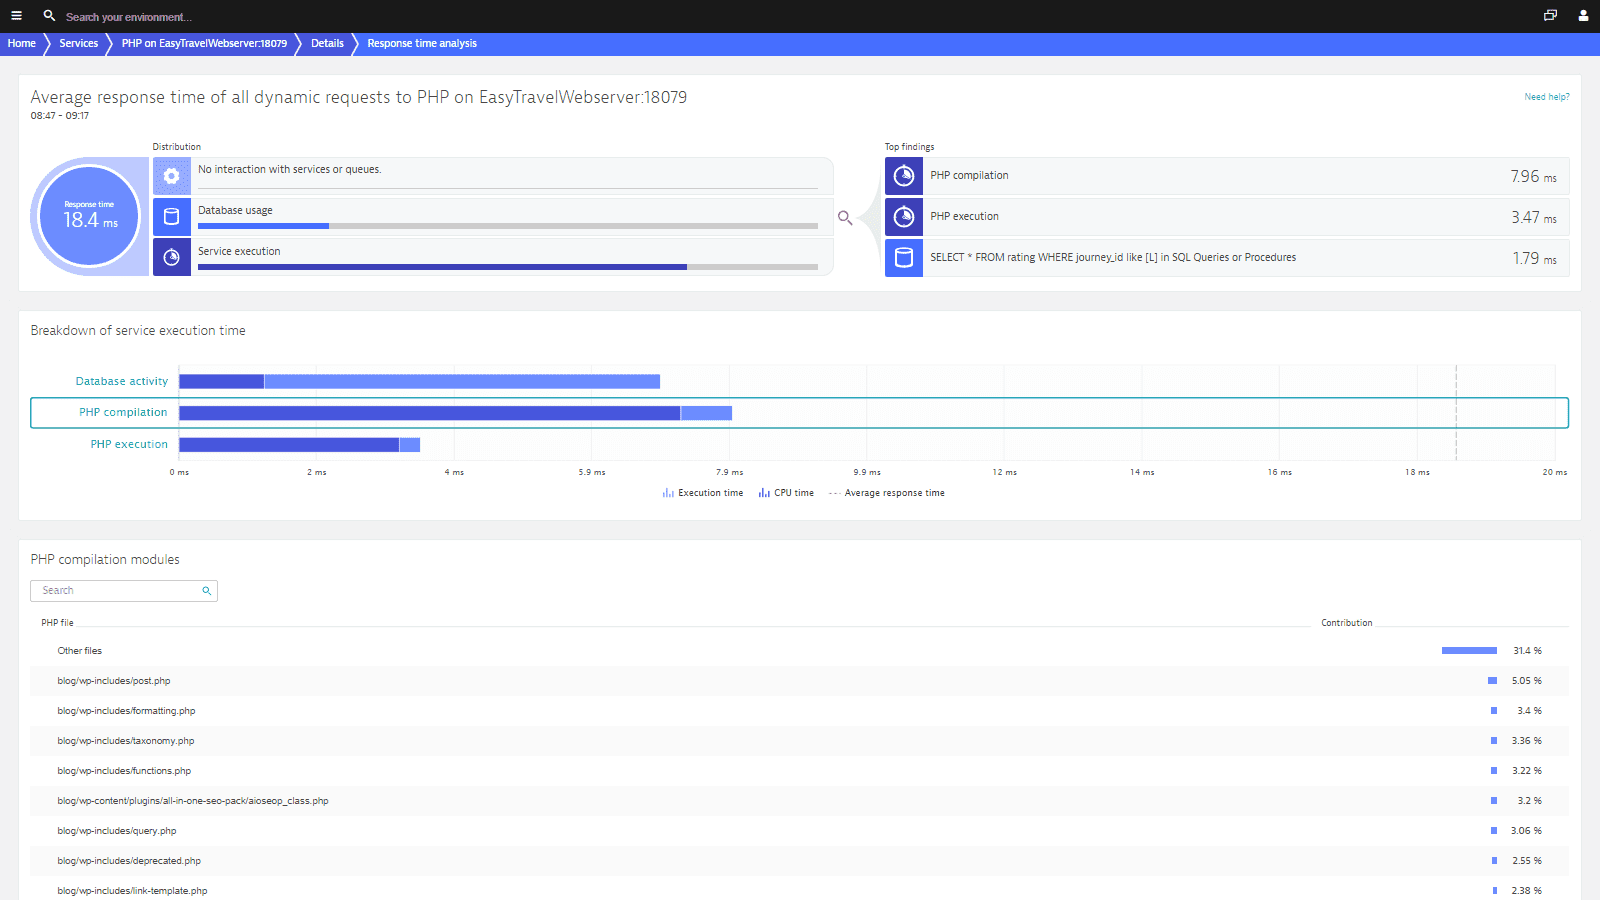
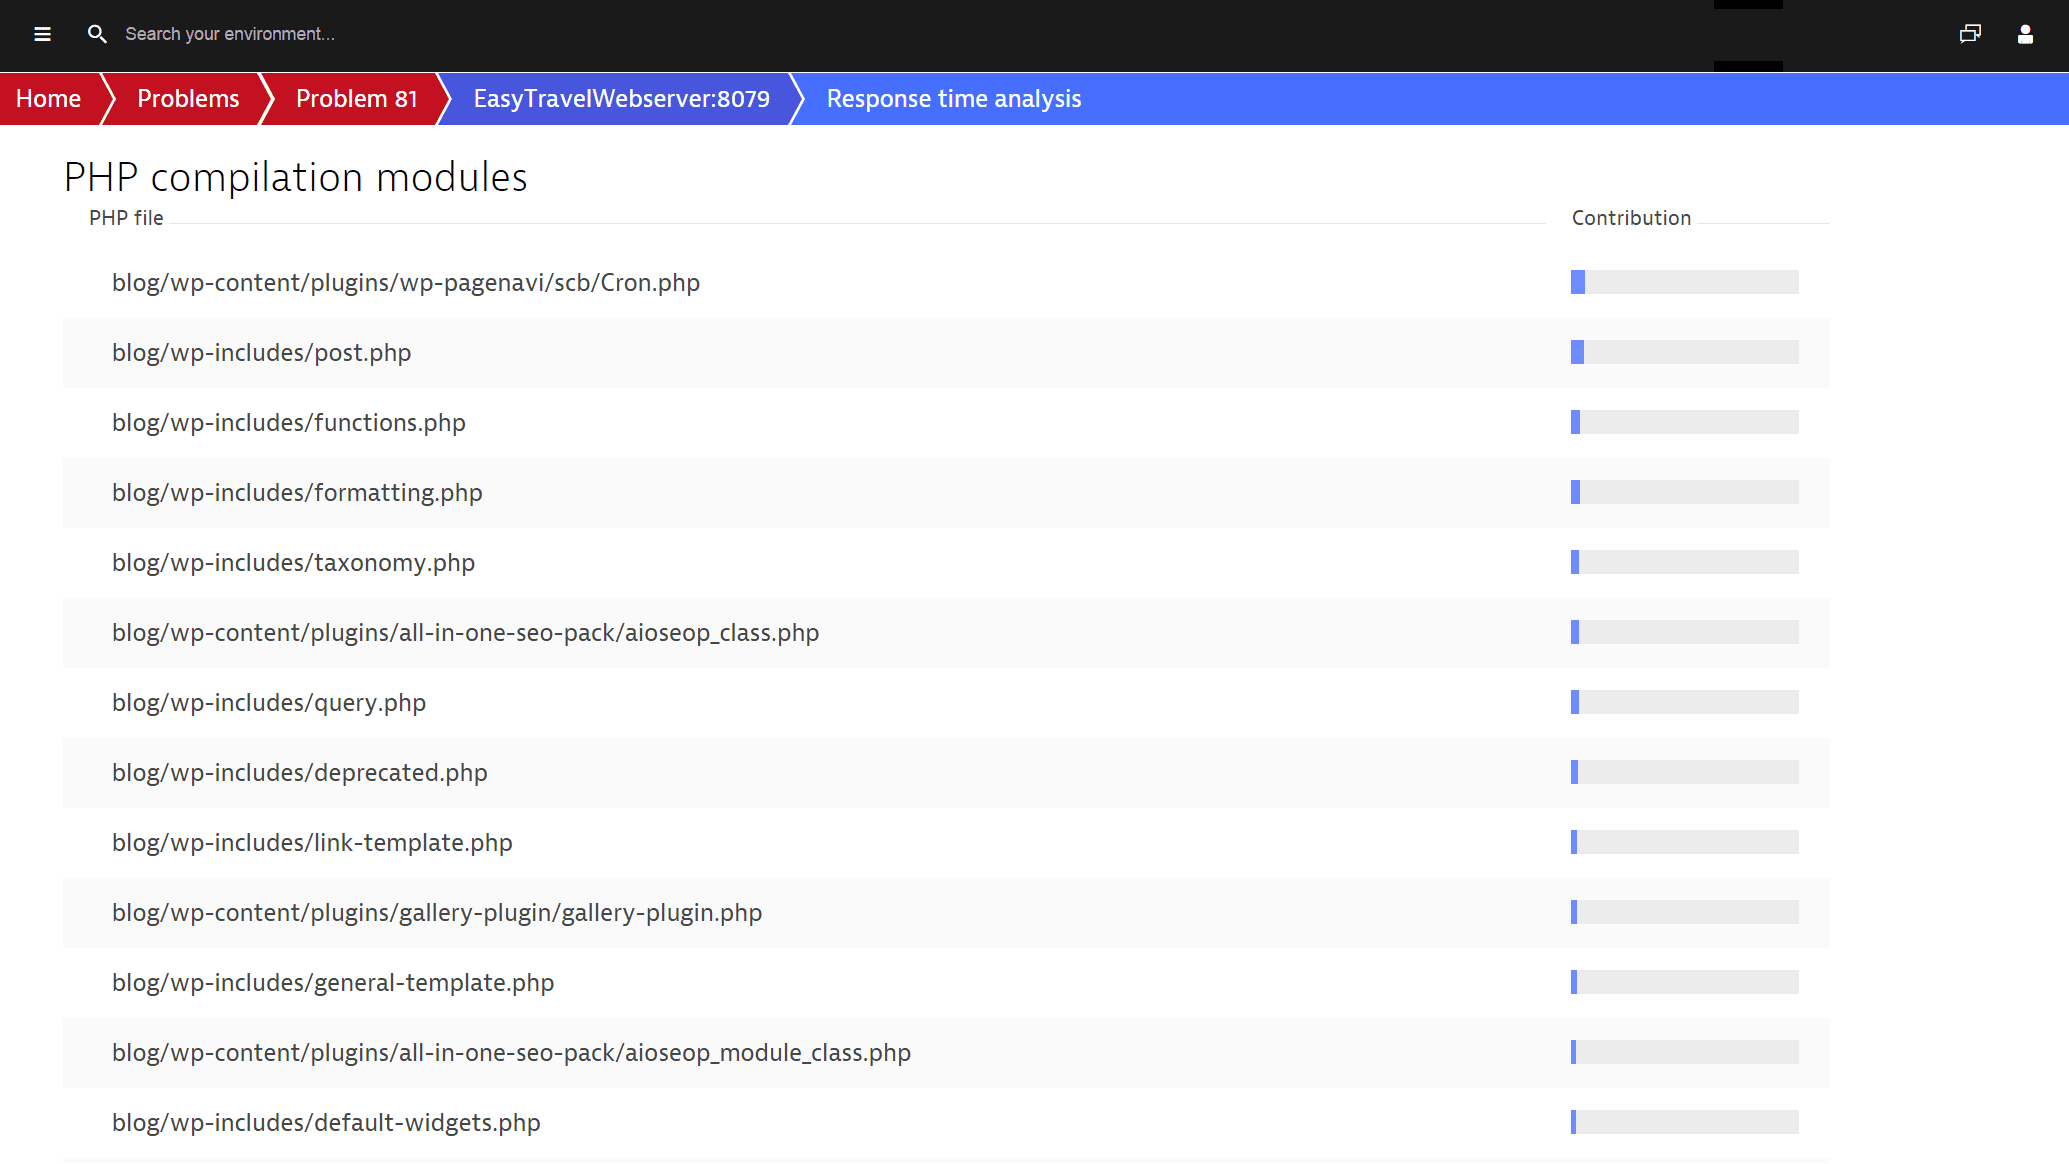
Know your app’s PHP compilation behavior
PHP compilation can negatively affect system performance.
Dynatrace shows PHP compilation metrics and their contribution to response times, so you’ll know when it’s time to give OPcache a try.
Finally, a tool that understands Apache modules
Configuring Apache modules can be tricky and time-consuming.
Dynatrace is fully aware of all module configurations and delivers a comprehensive list of all module response time contributions.
Now you can easily identify unnecessary module overhead and improve your module configurations in no time!

Ready to put the Dynatrace platform to work?
