

Java monitoring
Monitor and optimize Java application performance for your entire application stack, including databases and services.
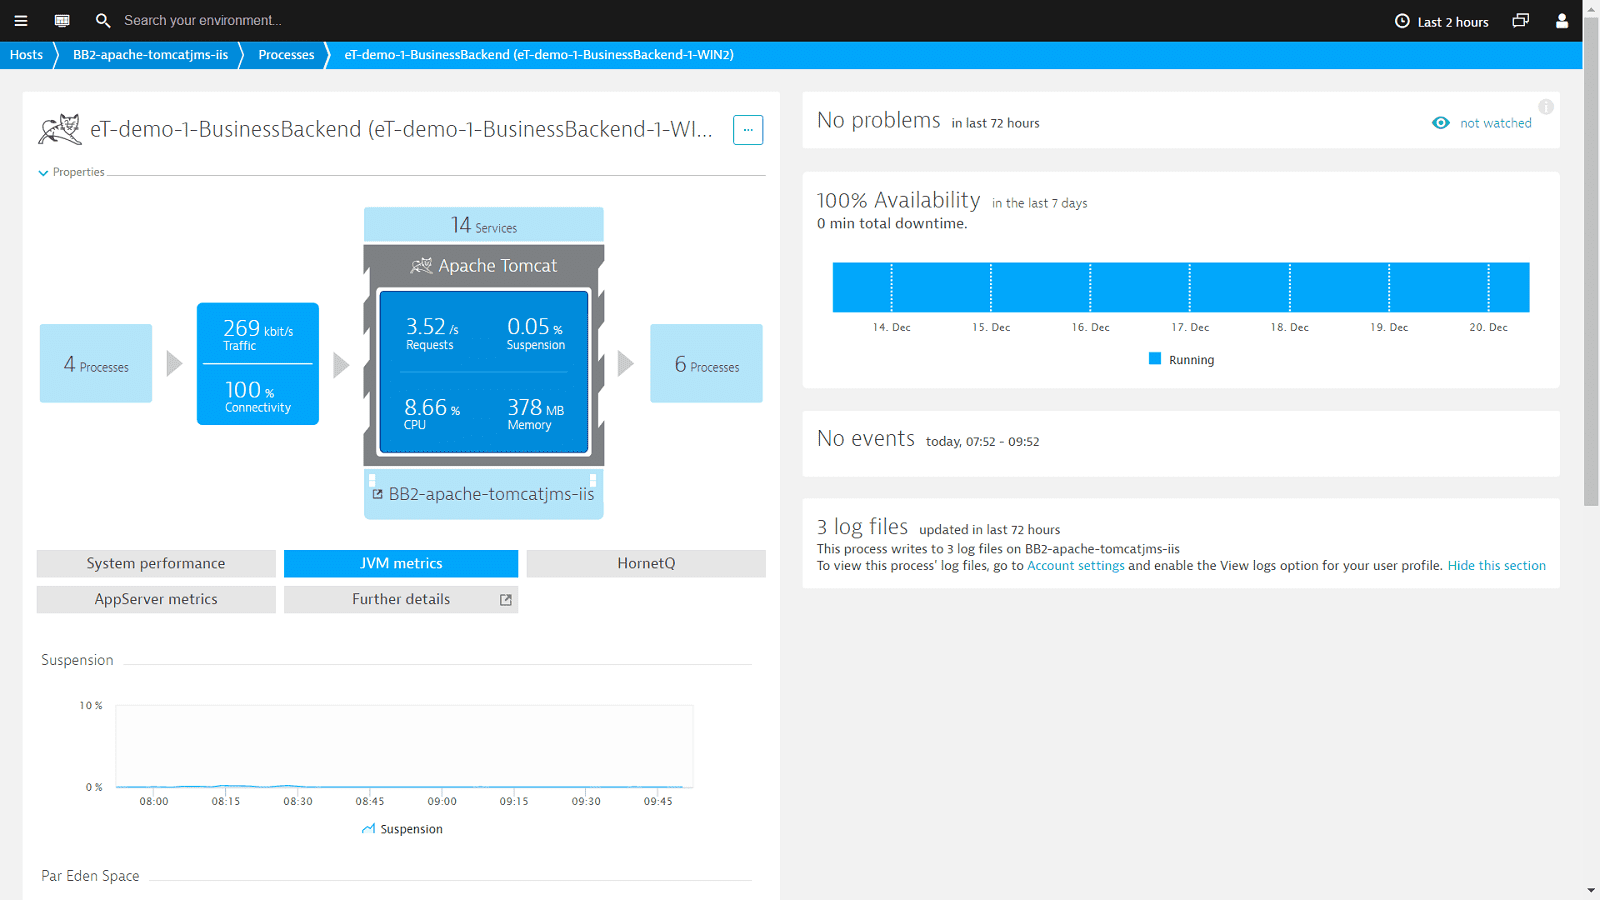
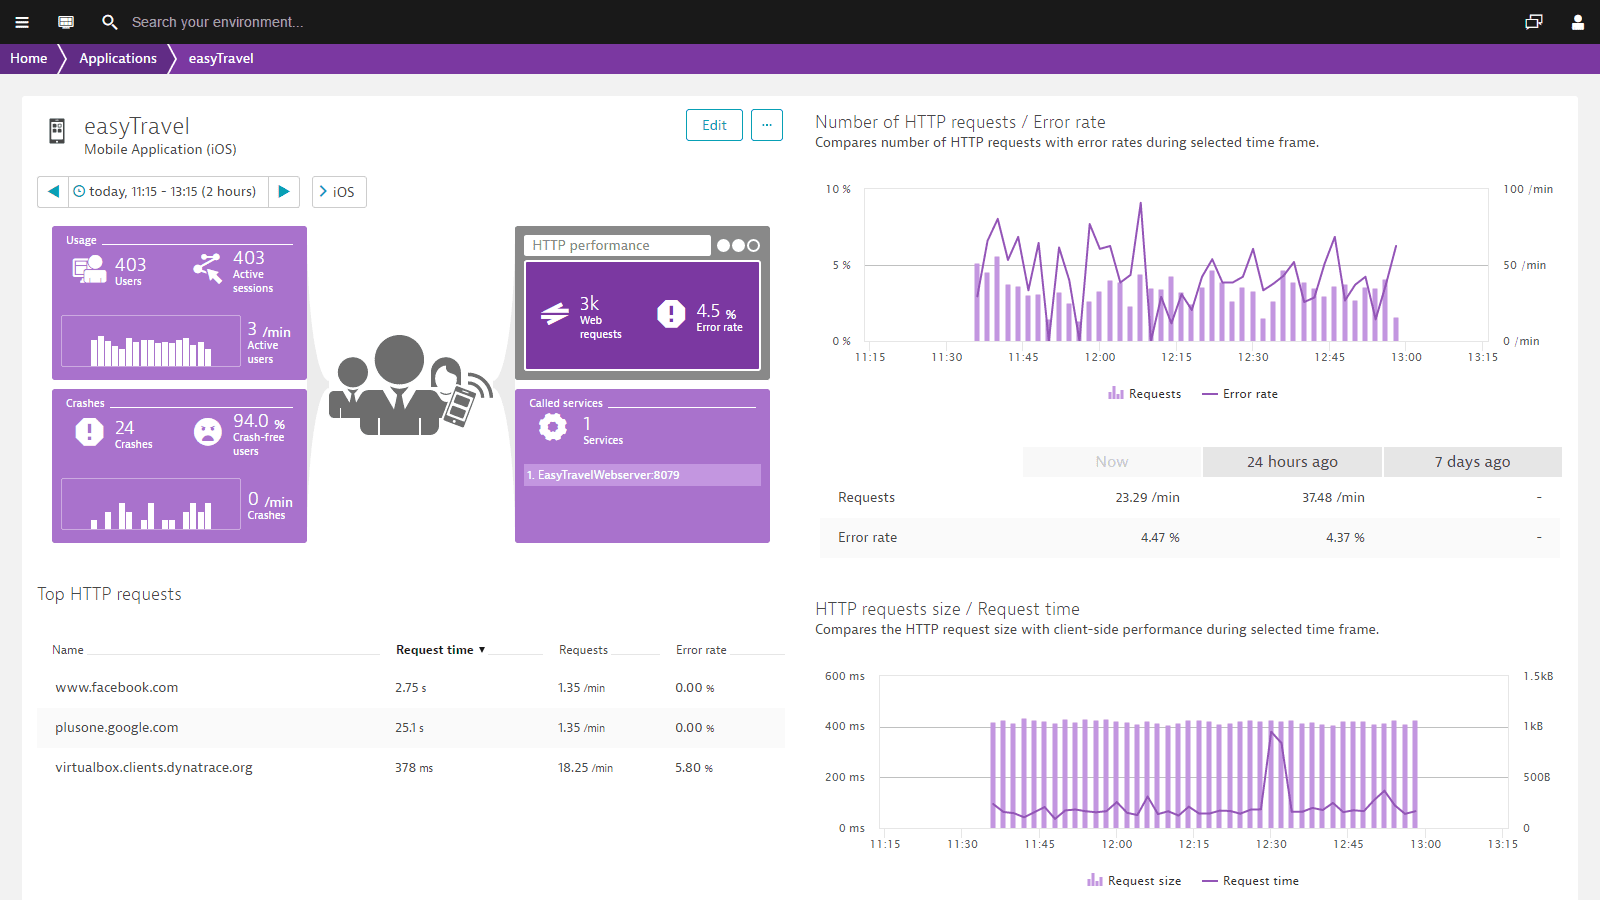
Monitor all Java performance metrics in real-time
- Dynatrace captures every transaction, across every tier, without gaps or blind spots.
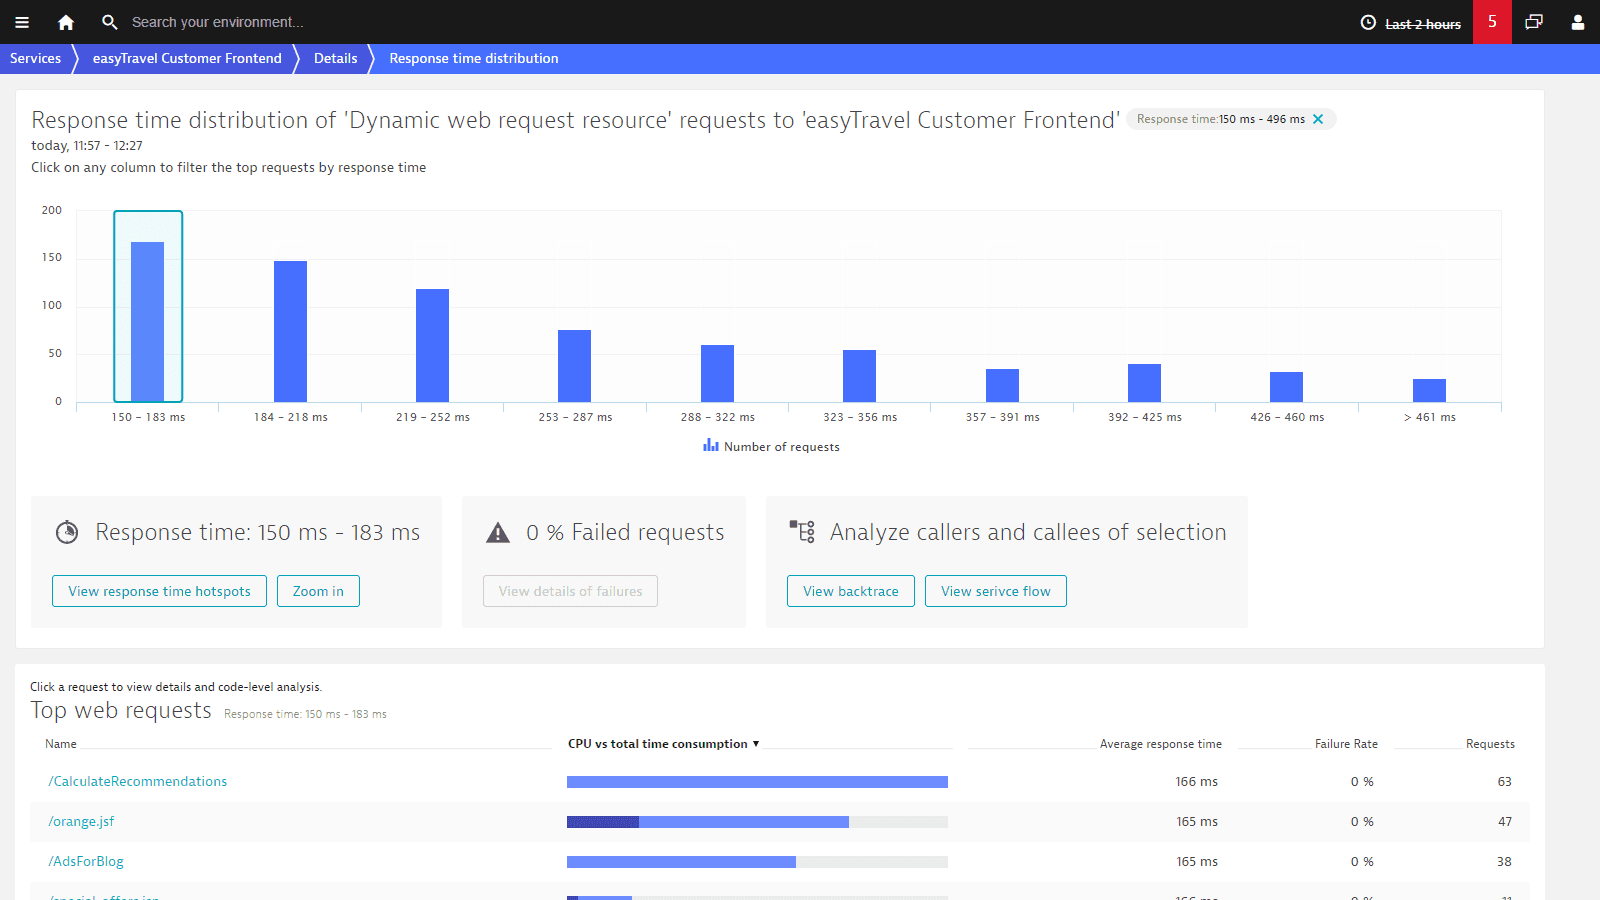
- Pre-configured dashboards provide all relevant metrics down to SQL statement and code level.
- In under five minutes our OneAgent automatically discovers your entire Java application stack.
- Improve the performance of your Java code with continuous insights into your applications.
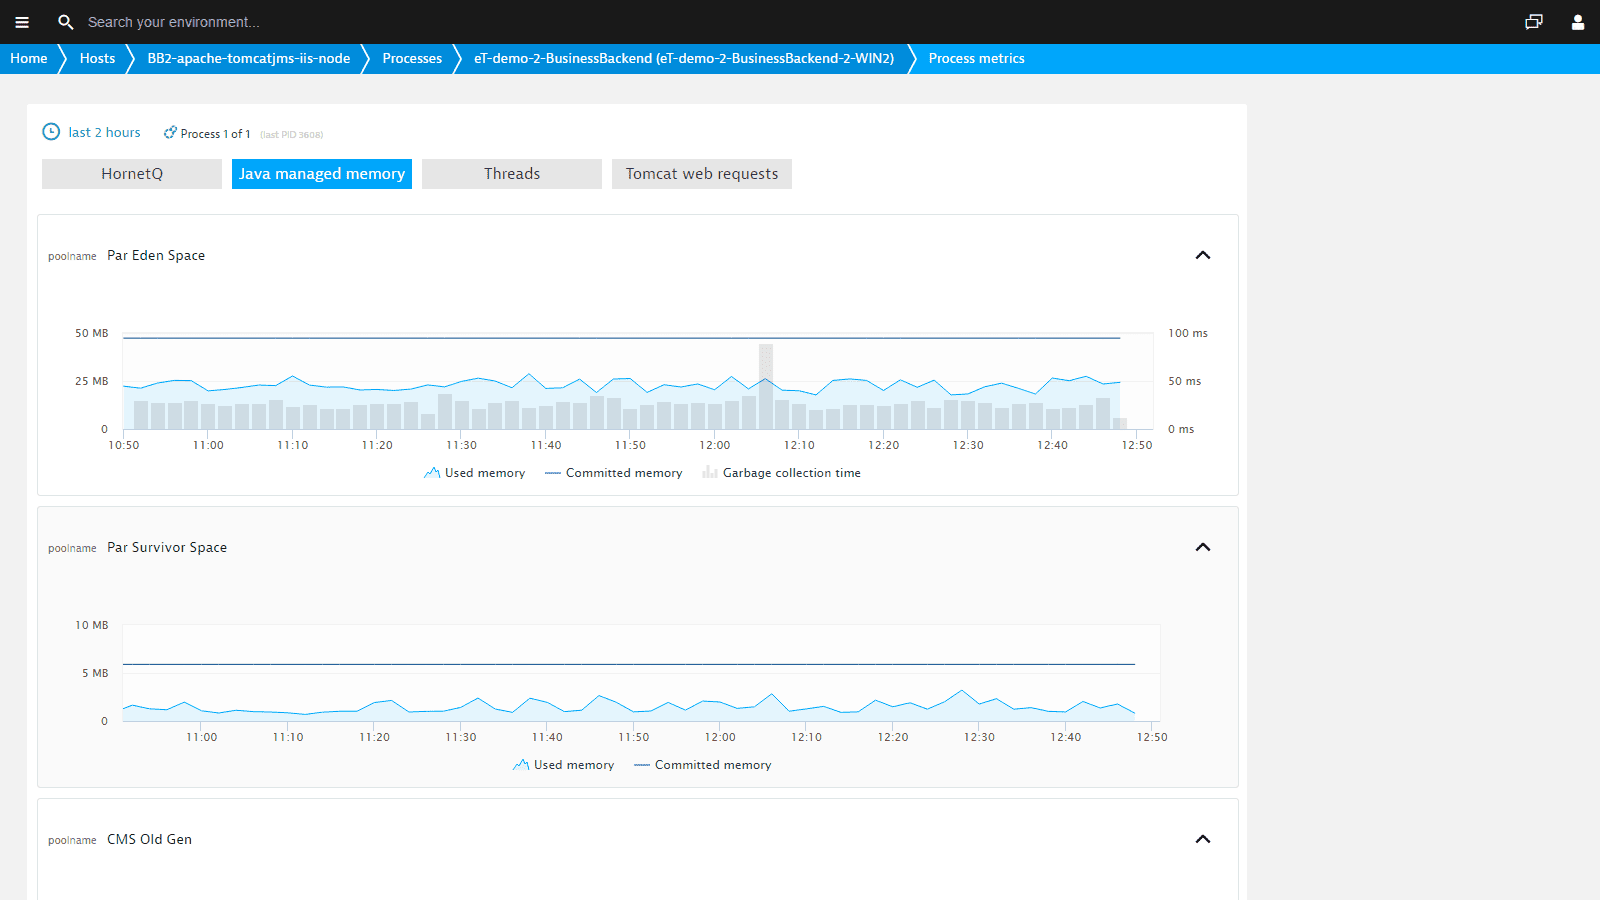
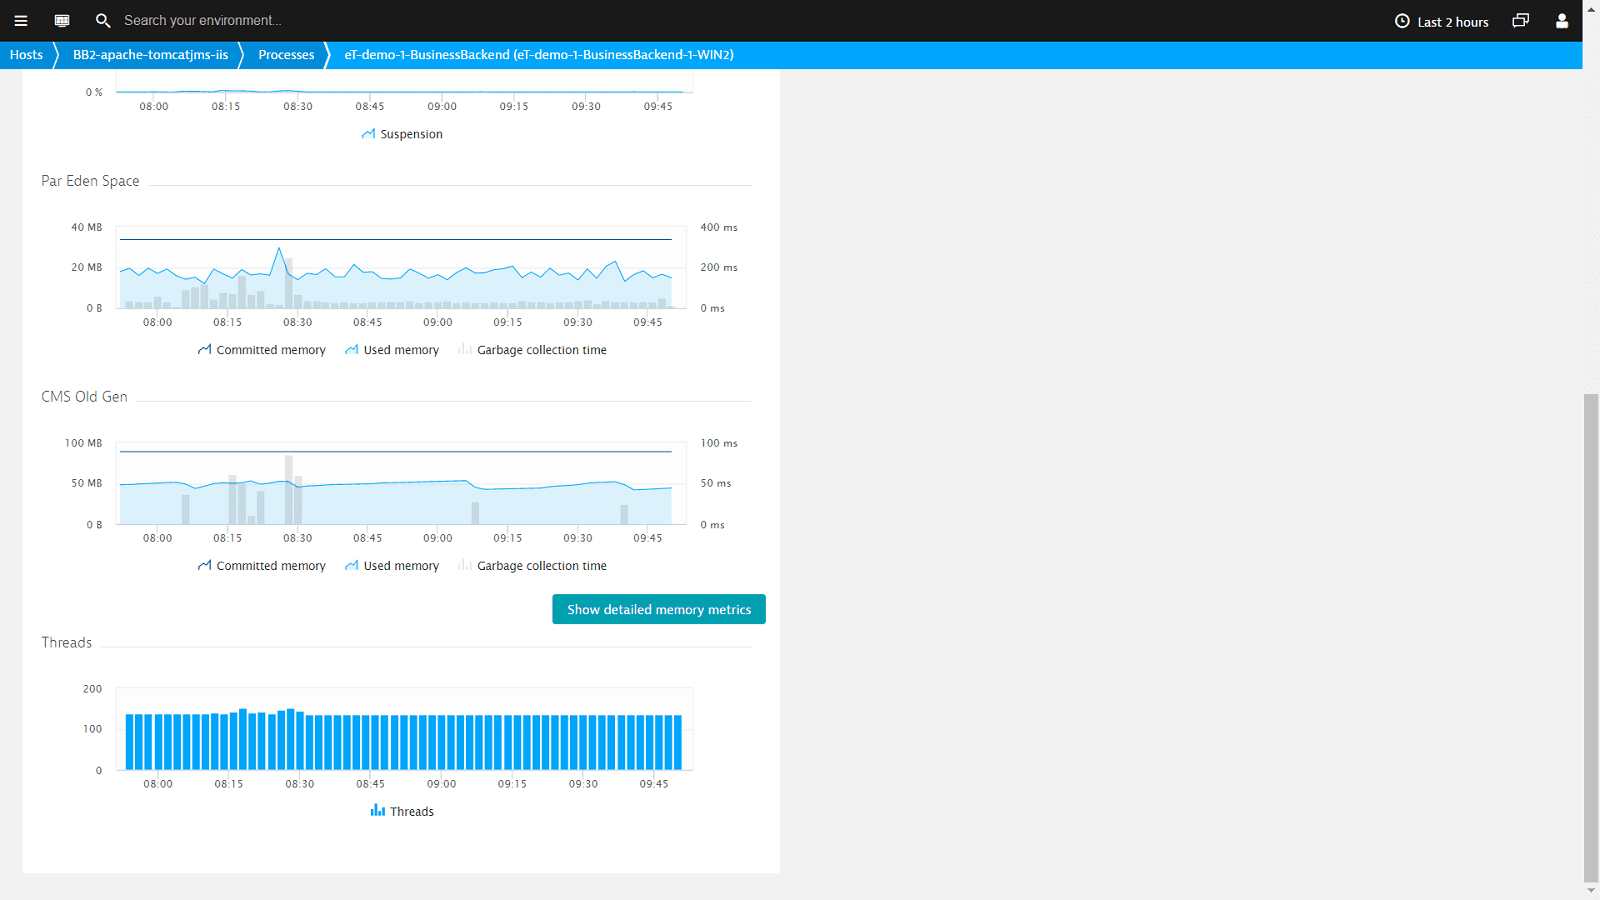
Get all Java performance details
- JVM metrics
- Garbage collection metrics
- Web request and response size
- Busy and idle threads
- Custom JMX metrics
- Java managed memory
- Response time
- Failure rate
- Throughput
- Request and response sizes
- All database statements
- Restarts, crashes, deployment changes
- Apdex score
- CPU and memory usage
- Garbage collection suspension time
- Network traffic
- TCP requests and retransmissions
- All requests, all dependencies
Sign up for Dynatrace Java monitoring today!
You’ll be up and running in under 5 minutes:
Sign up, deploy our agent and get unmatched insights out-of-the-box.

Follow every single transaction, end-to-end
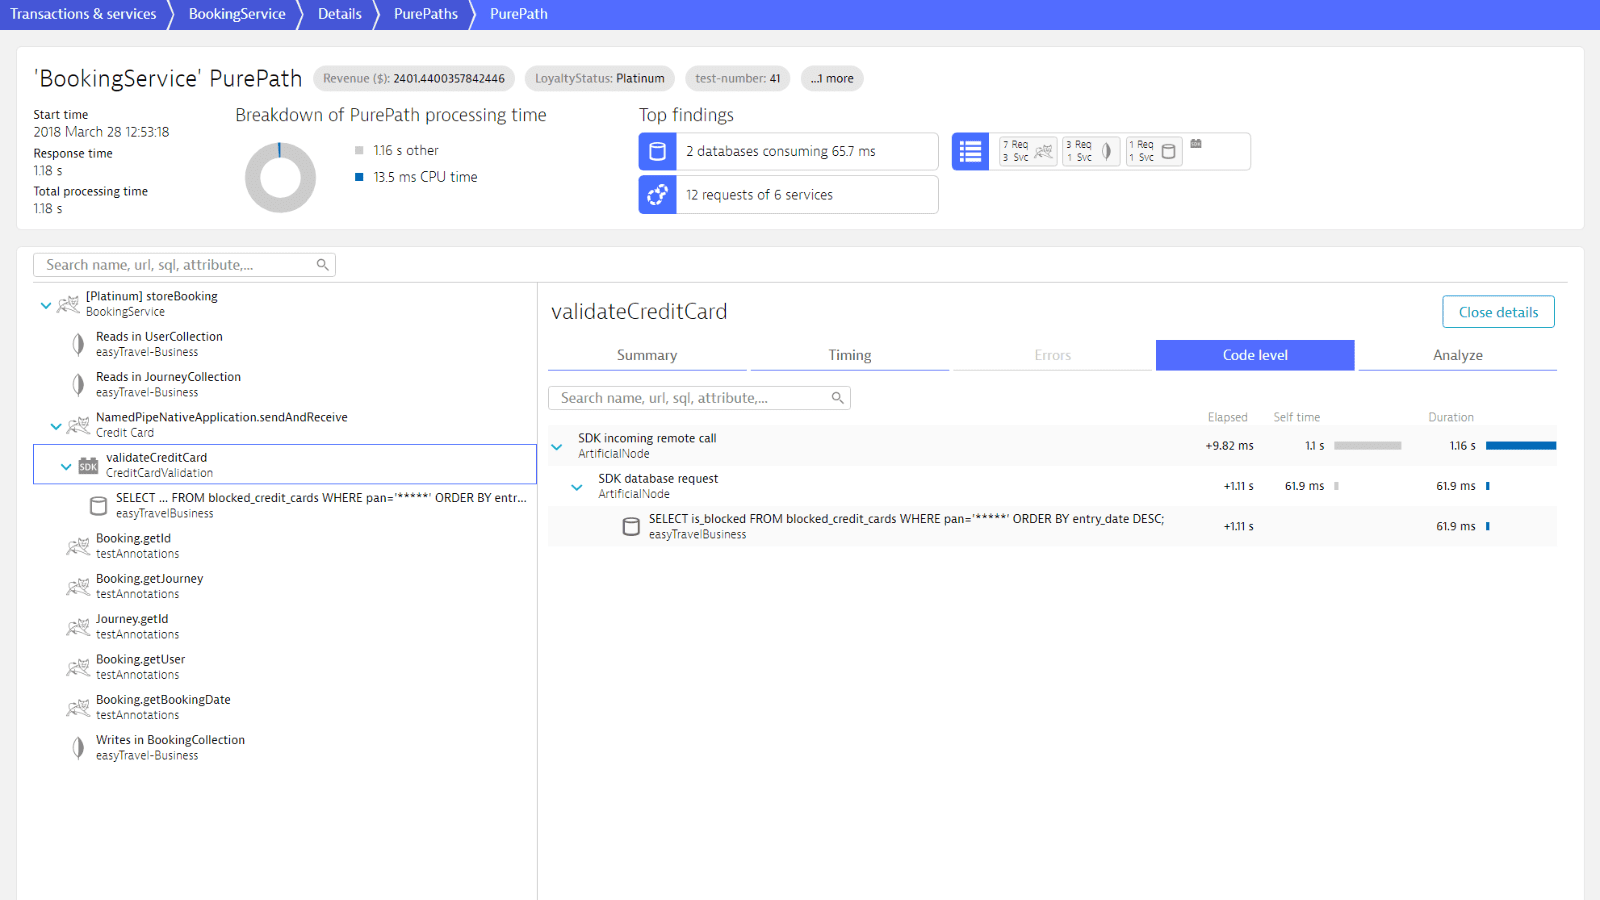
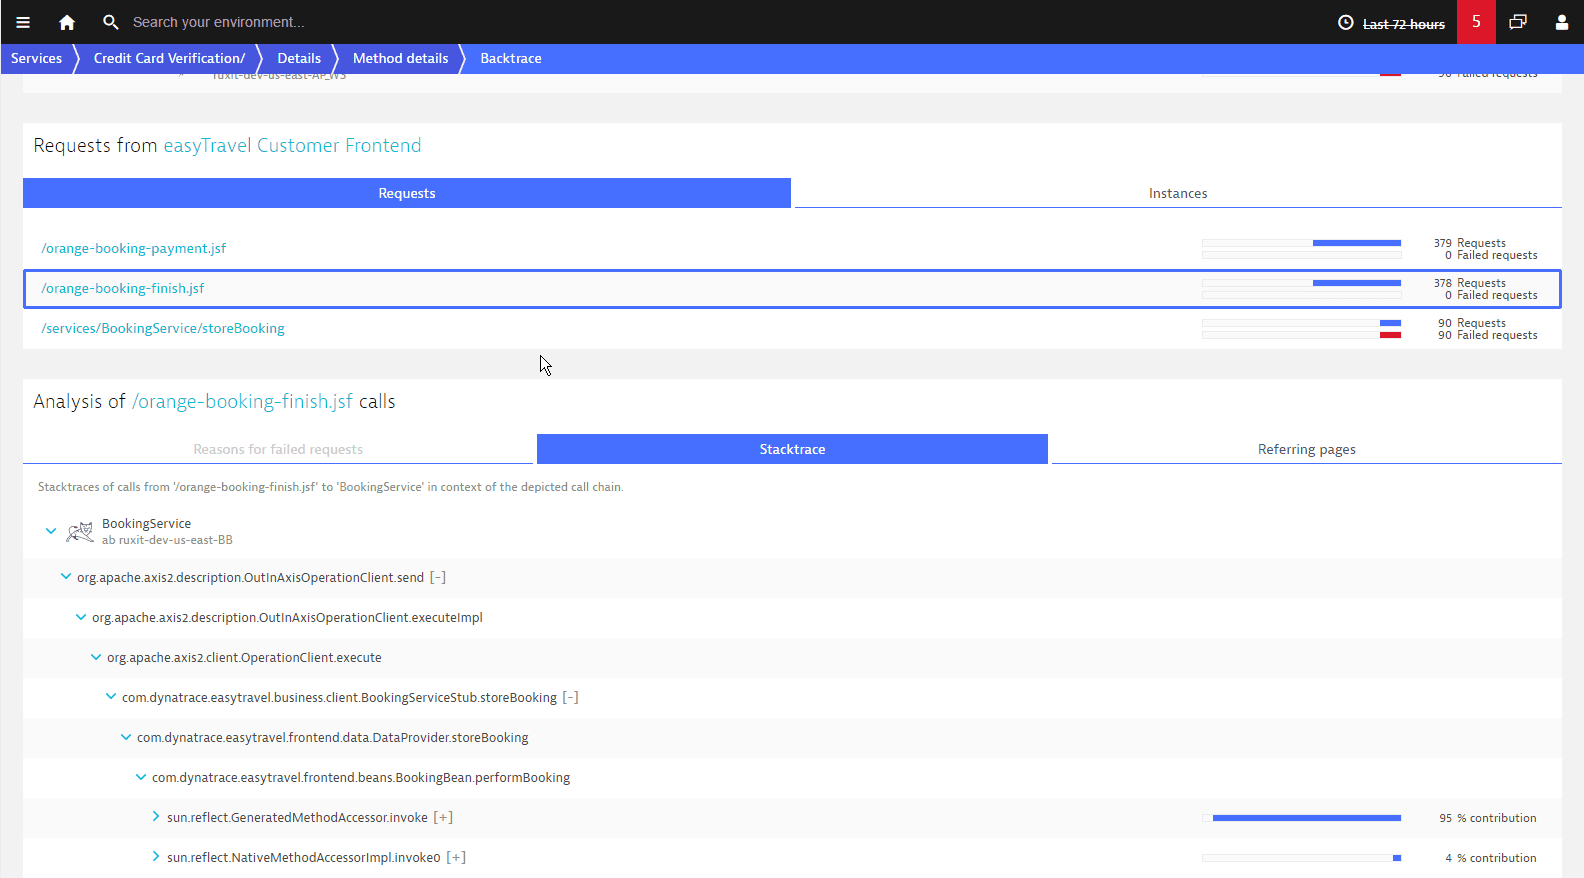
Dynatrace uses patented PurePath Technology® to capture timing and code-level context for every transaction, across every tier, without gaps or blind spots.
- Drill into all services and components called upon a single user interaction.
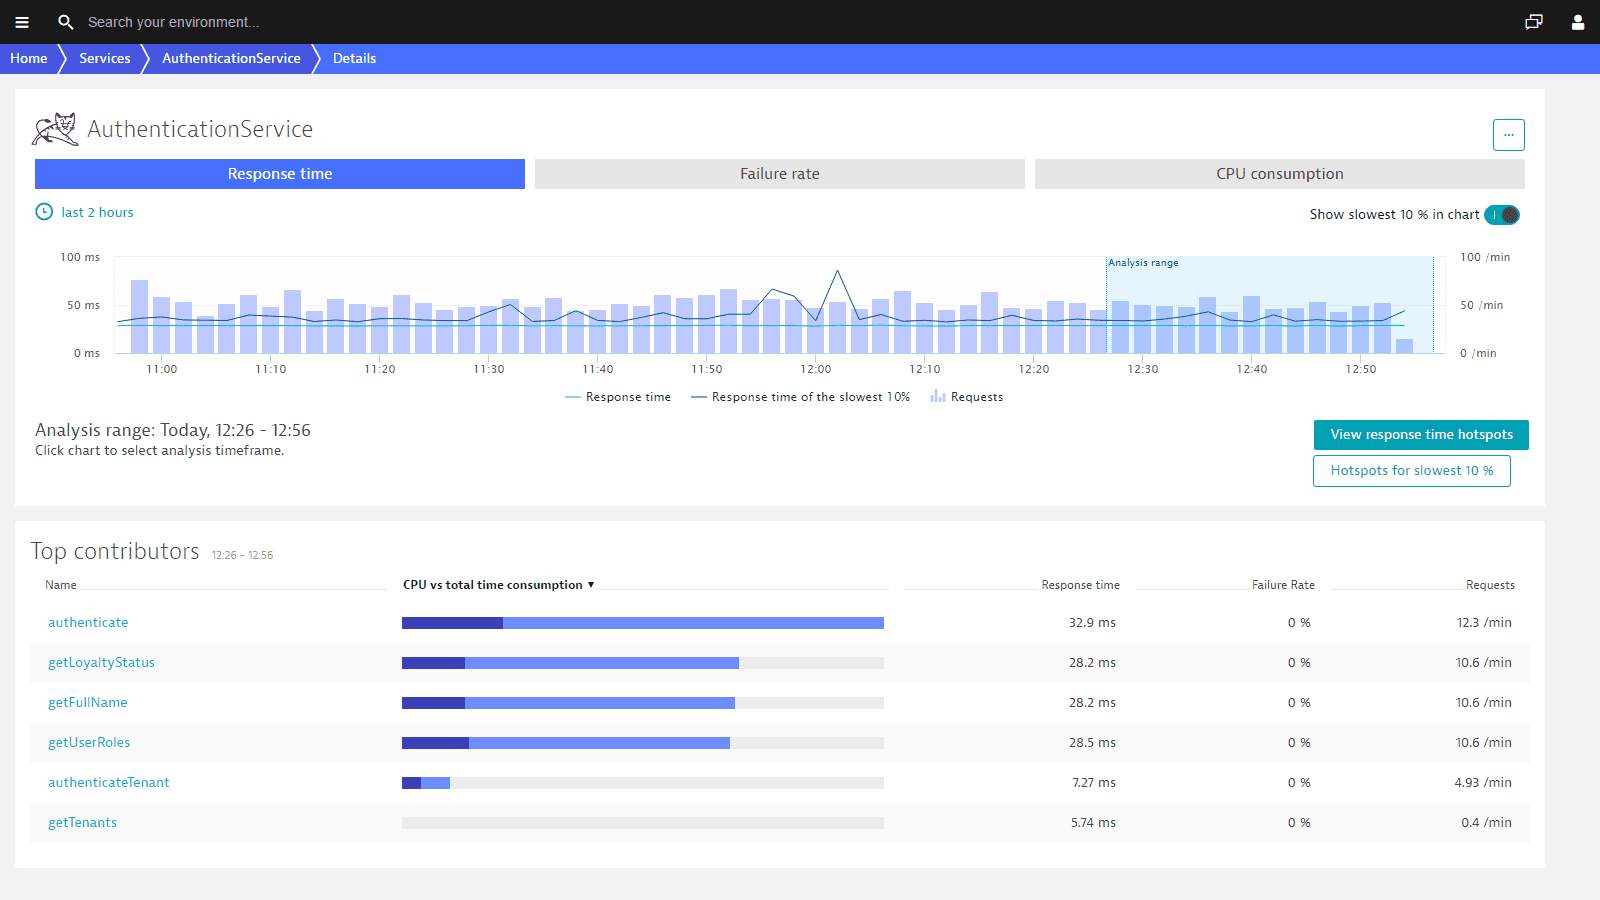
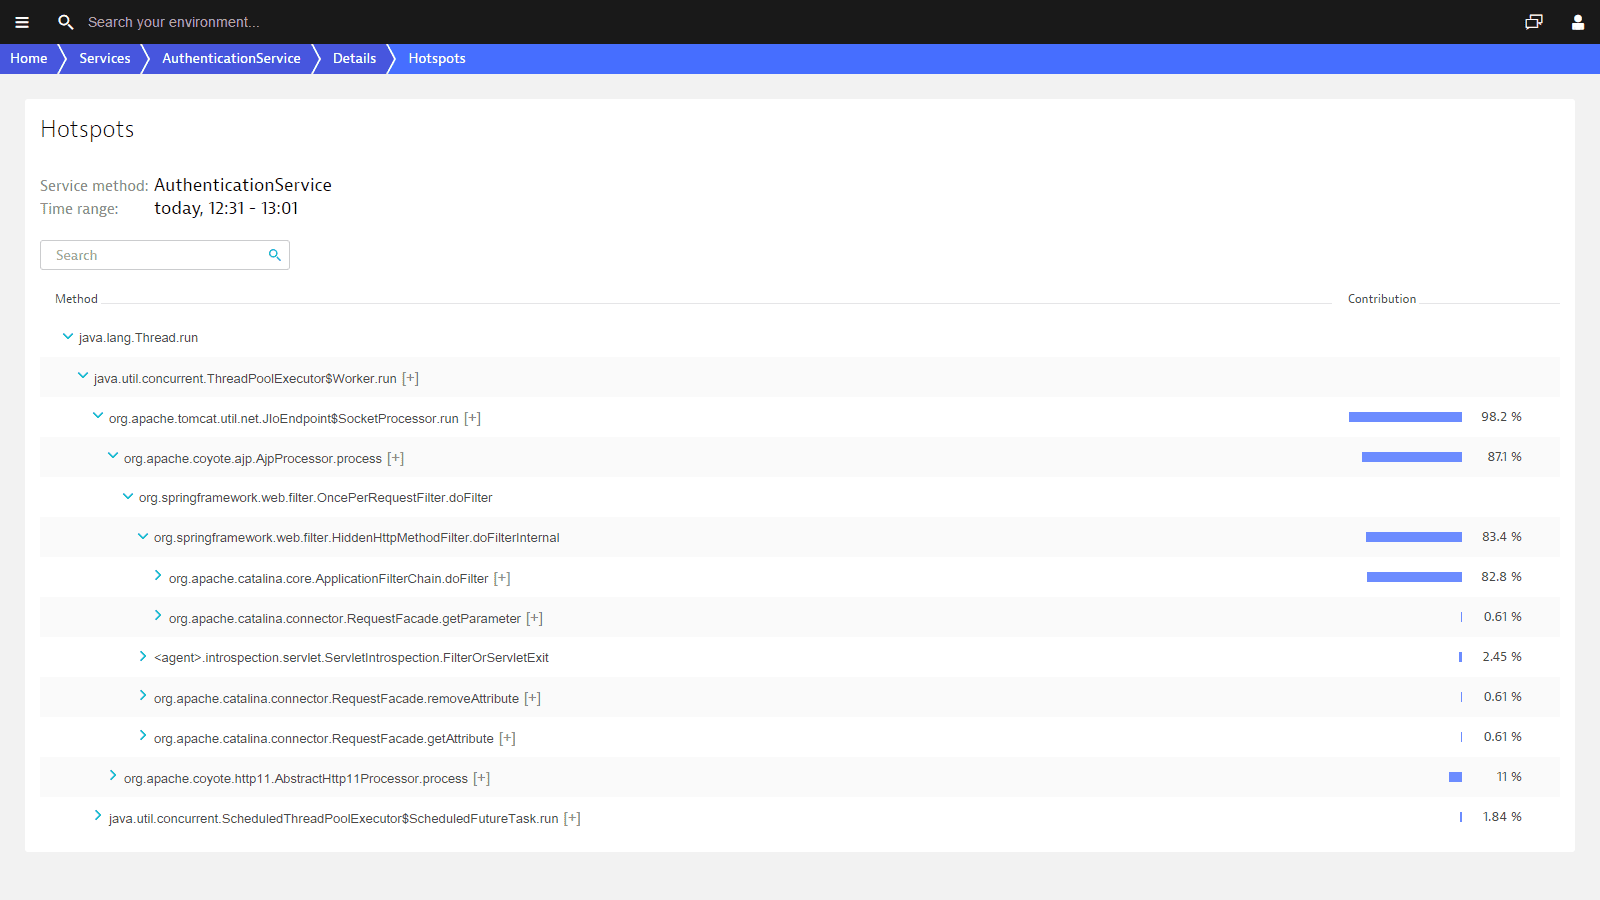
- Analyze response times and find hotspots at the method level.
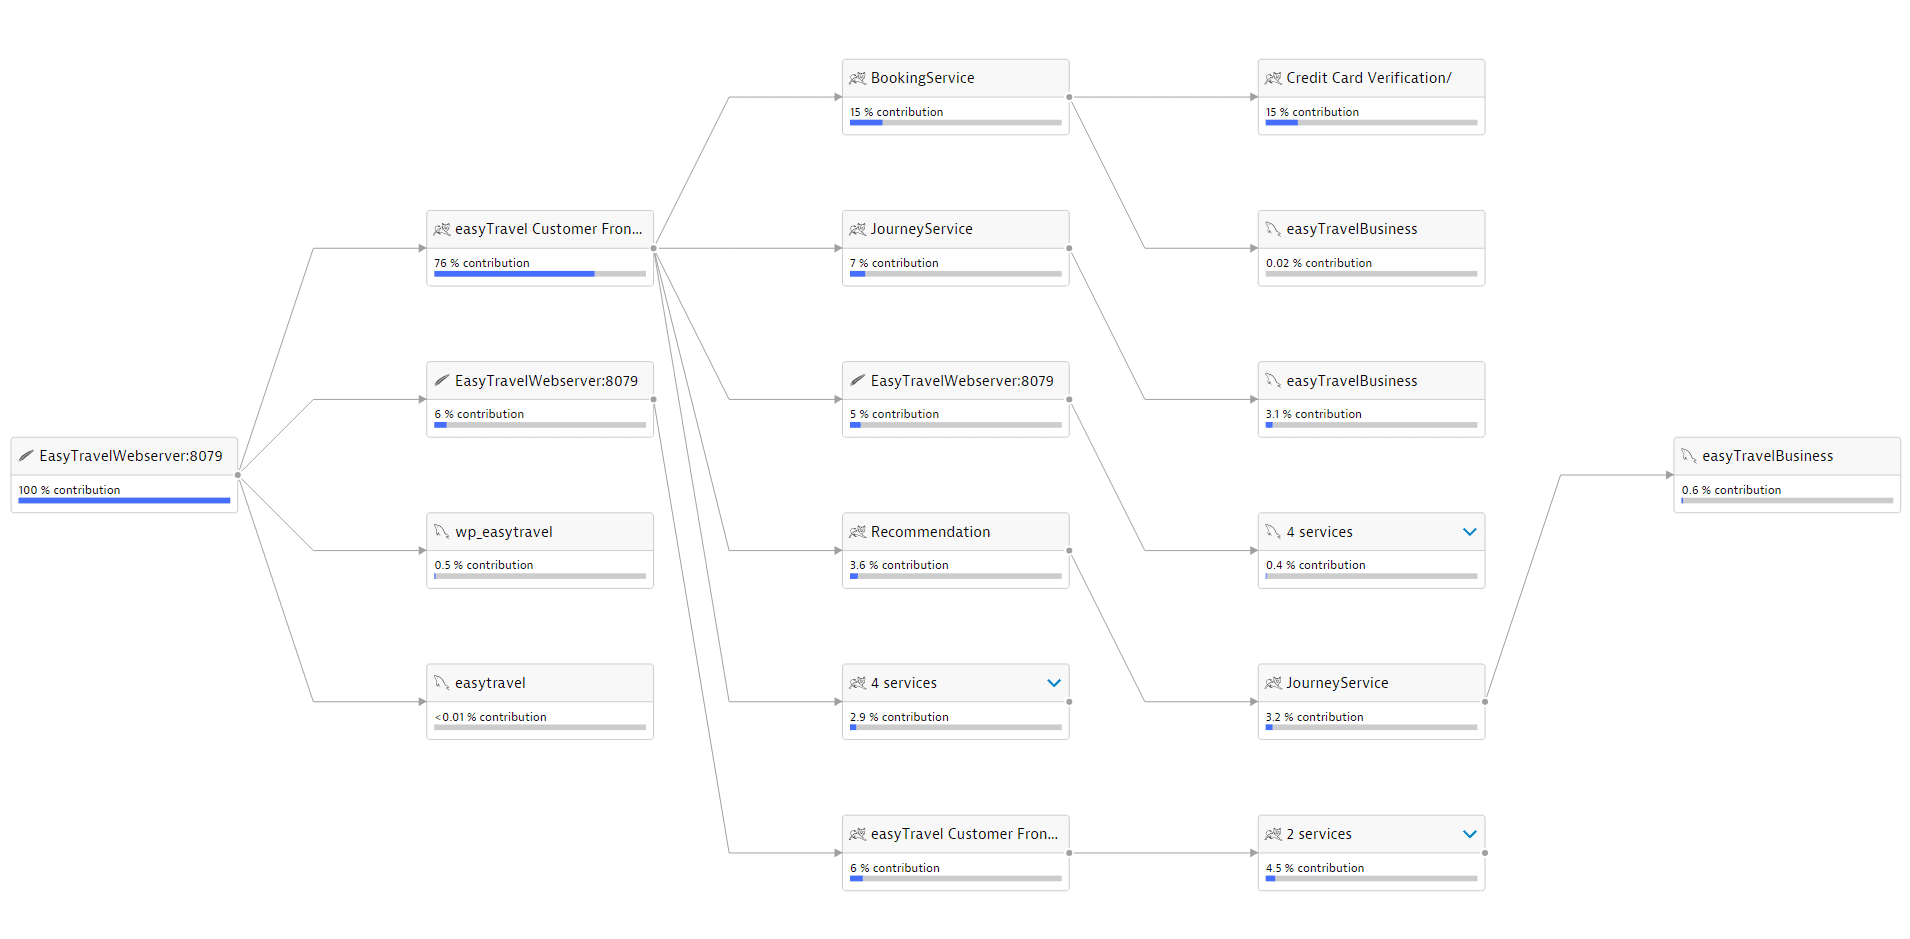
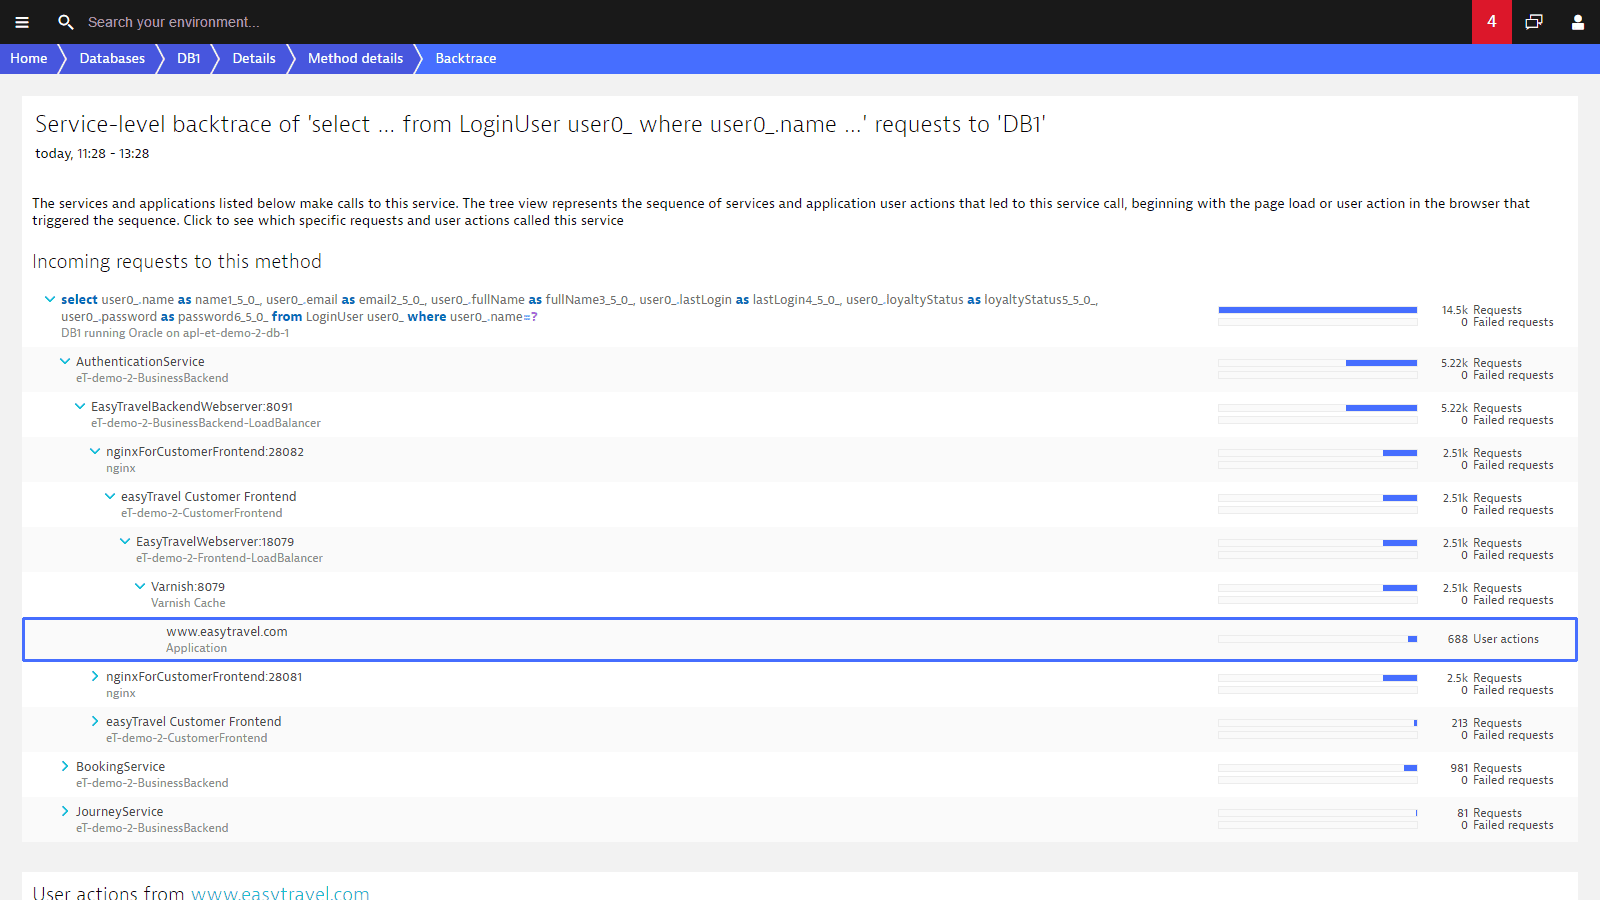
- Understand the impact of methods and database statements on user experience with our unique backtrace capability.

Monitor any JVM, server, or application
The Dynatrace UI isn’t bloated with metrics. We show you what really matters and allow you to drill down into more detailed metrics when you need them. Dynatrace instruments your Java applications at the bytecode level. It makes no difference if your applications are console applications or web services; we provide all the monitoring features you need.
Dynatrace provides Java monitoring for applications running in Tomcat containers as well as JBoss, WildFly, GlassFish, WebSphere, and other servers. Of course we also support other JVM languages like Scala, including frameworks such as Akka and Play.
Related content
 Webinar on-demand
Diagnosing and Boosting Java Application Performance
Java Applications tend to be scattered, and it is not always easy to diagnose performance issues.
In this session, Wayne Segar, Dynatrace Solution Consultant, examines some of the toughest problems solved in the last few years. We learn from him how to expand your performance bottleneck search arsenal.
 eBook
eBookIndustry's #1 Java Performance Reference
Senior leaders from the Dynatrace Labs and Center of Excellence teams have collaborated to develop the only definitive reference on practical, day-to-day application performance management.
This exclusive online eBook is the most comprehensive Java performance resource available anywhere.
 Blog post
Boost Java application performance (almost) automatically
One of the most resource-intensive components of a Java VM is the garbage collector (GC) which automatically reclaims unreferenced objects and makes their memory available for further allocation. What can you do about this?
Speed up a complex Java application in a few simple steps without changing code.


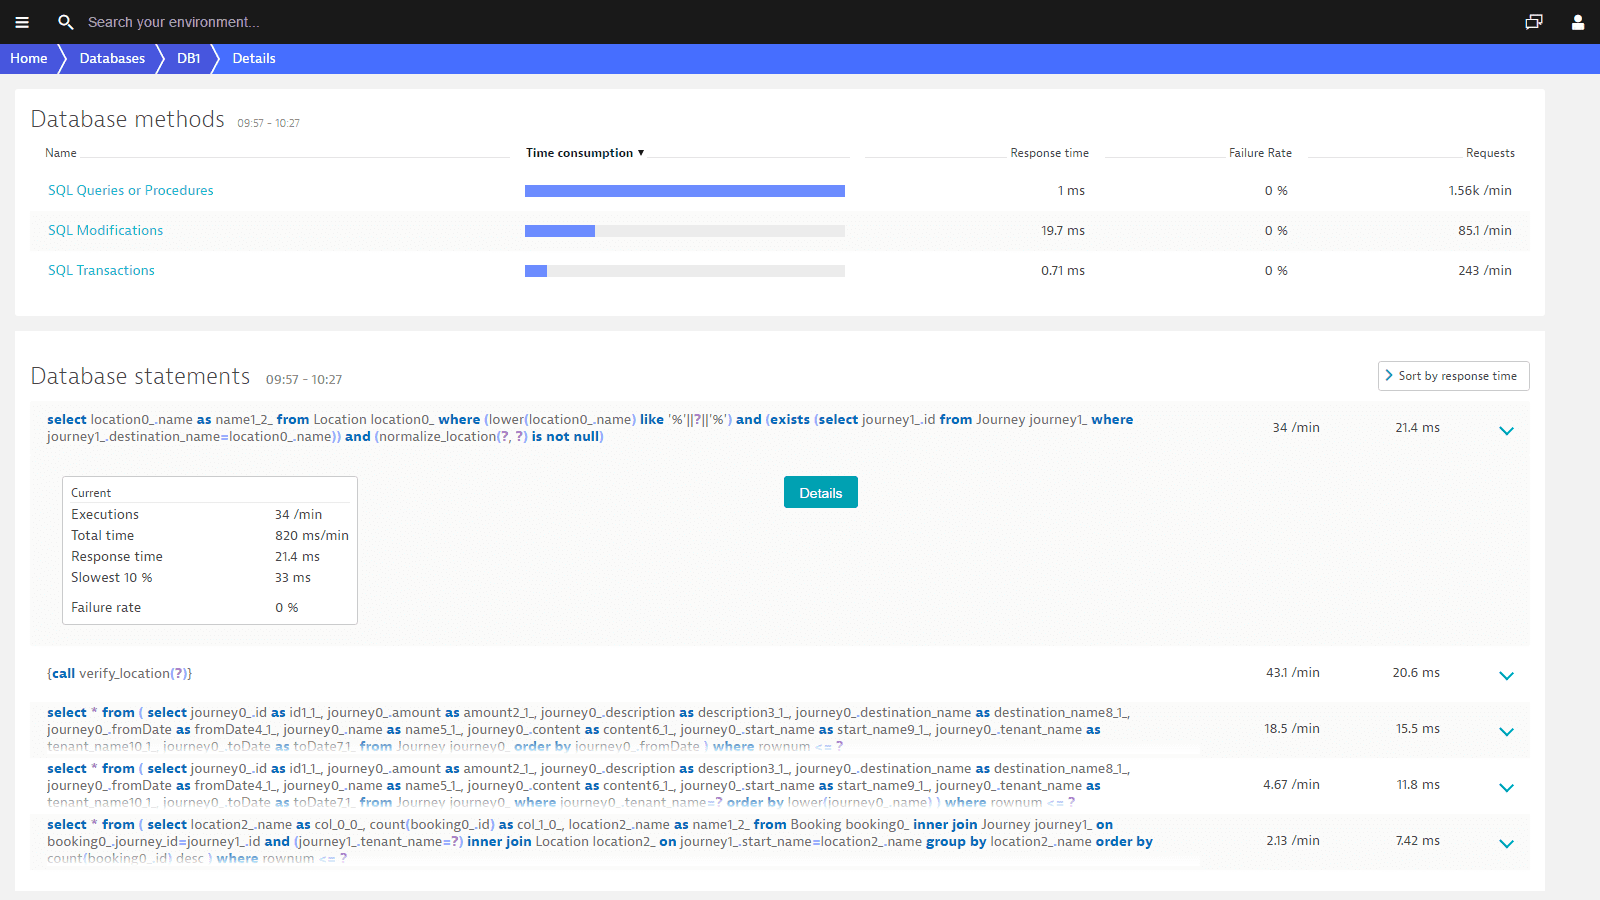
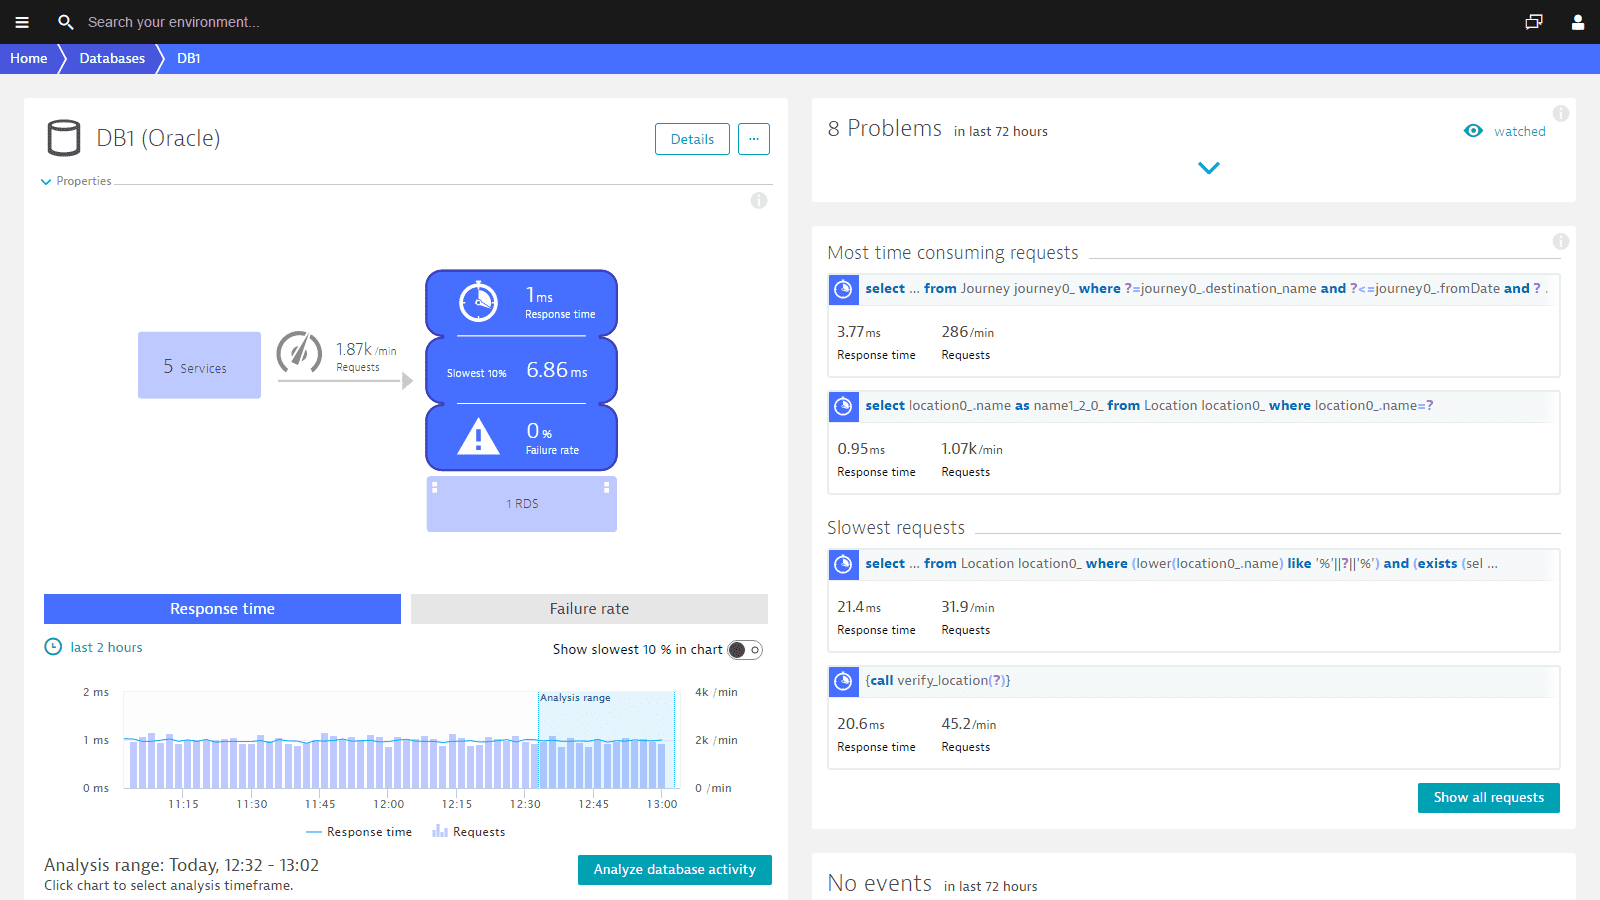
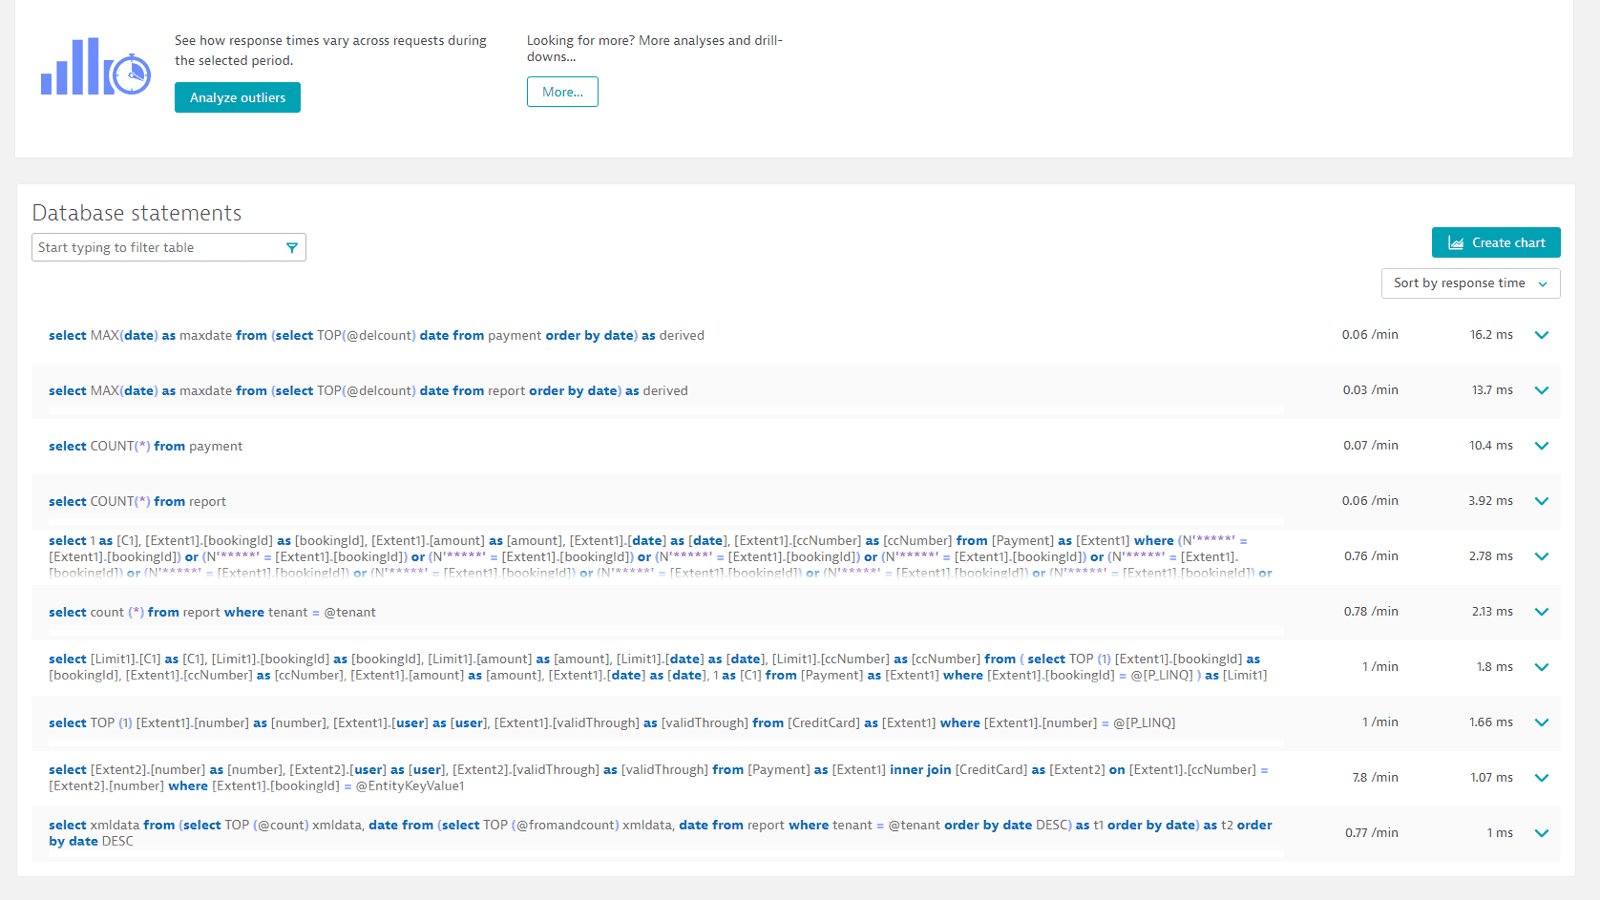
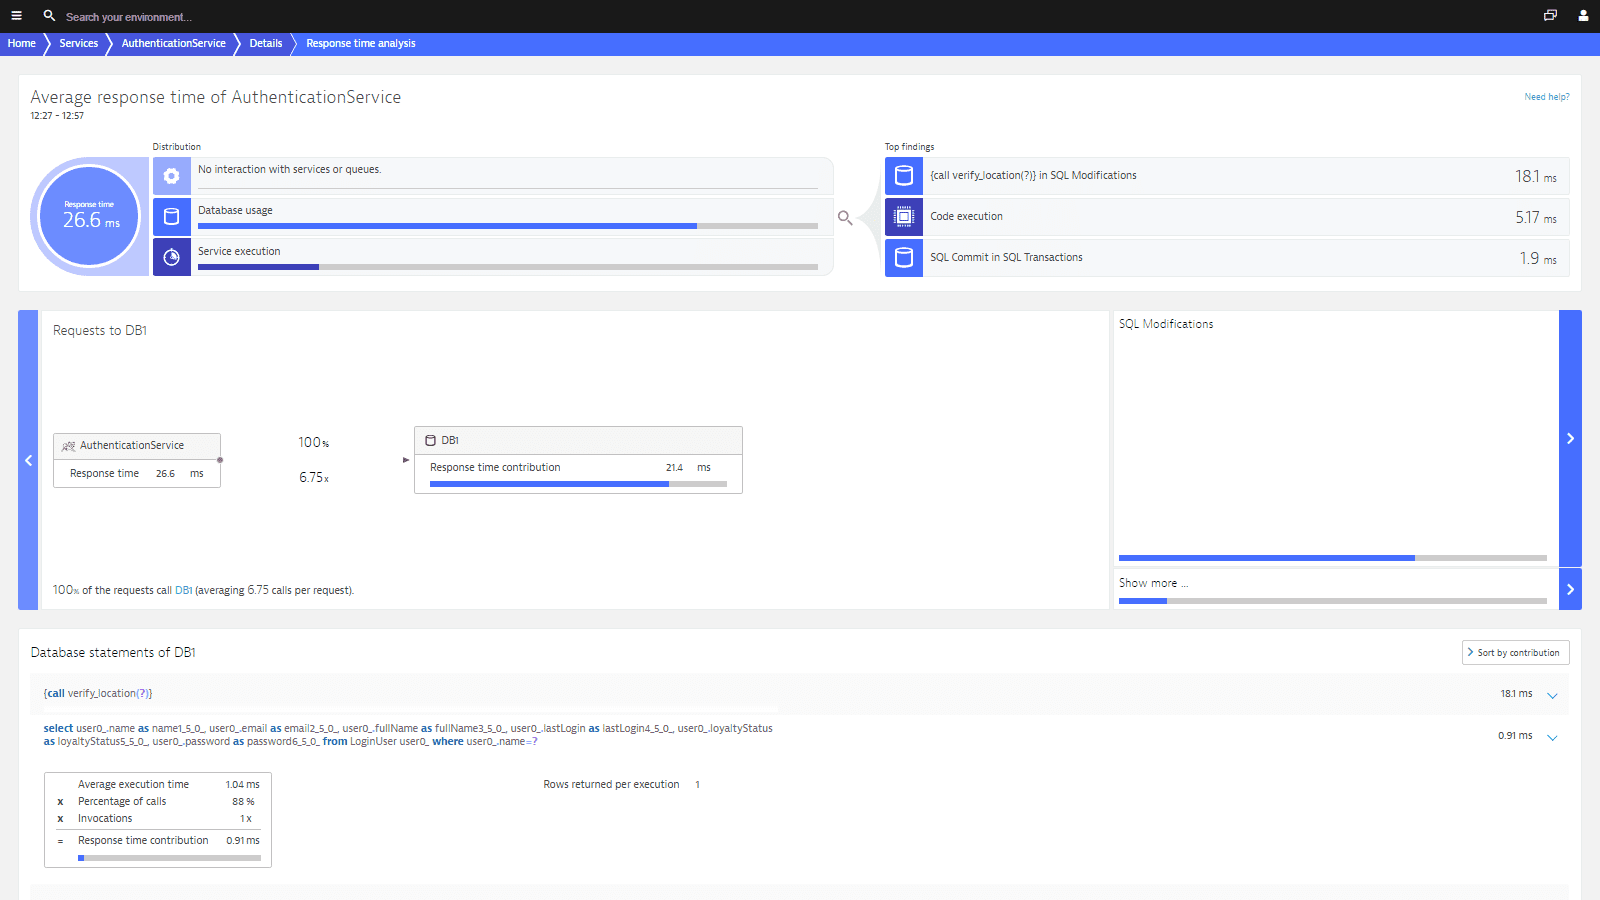
Monitor database query executions
Dynatrace tracks and inspects all SQL statements and NoSQL queries sent by your application. There is no better way to solve a database problem than to have the SQL statements in question directly on screen. See execution frequencies, response times, and long-running queries to JDBC-backed databases like MySQL, SQL Server, PostgreSQL and Oracle, as well as NoSQL databases like Cassandra and MongoDB.

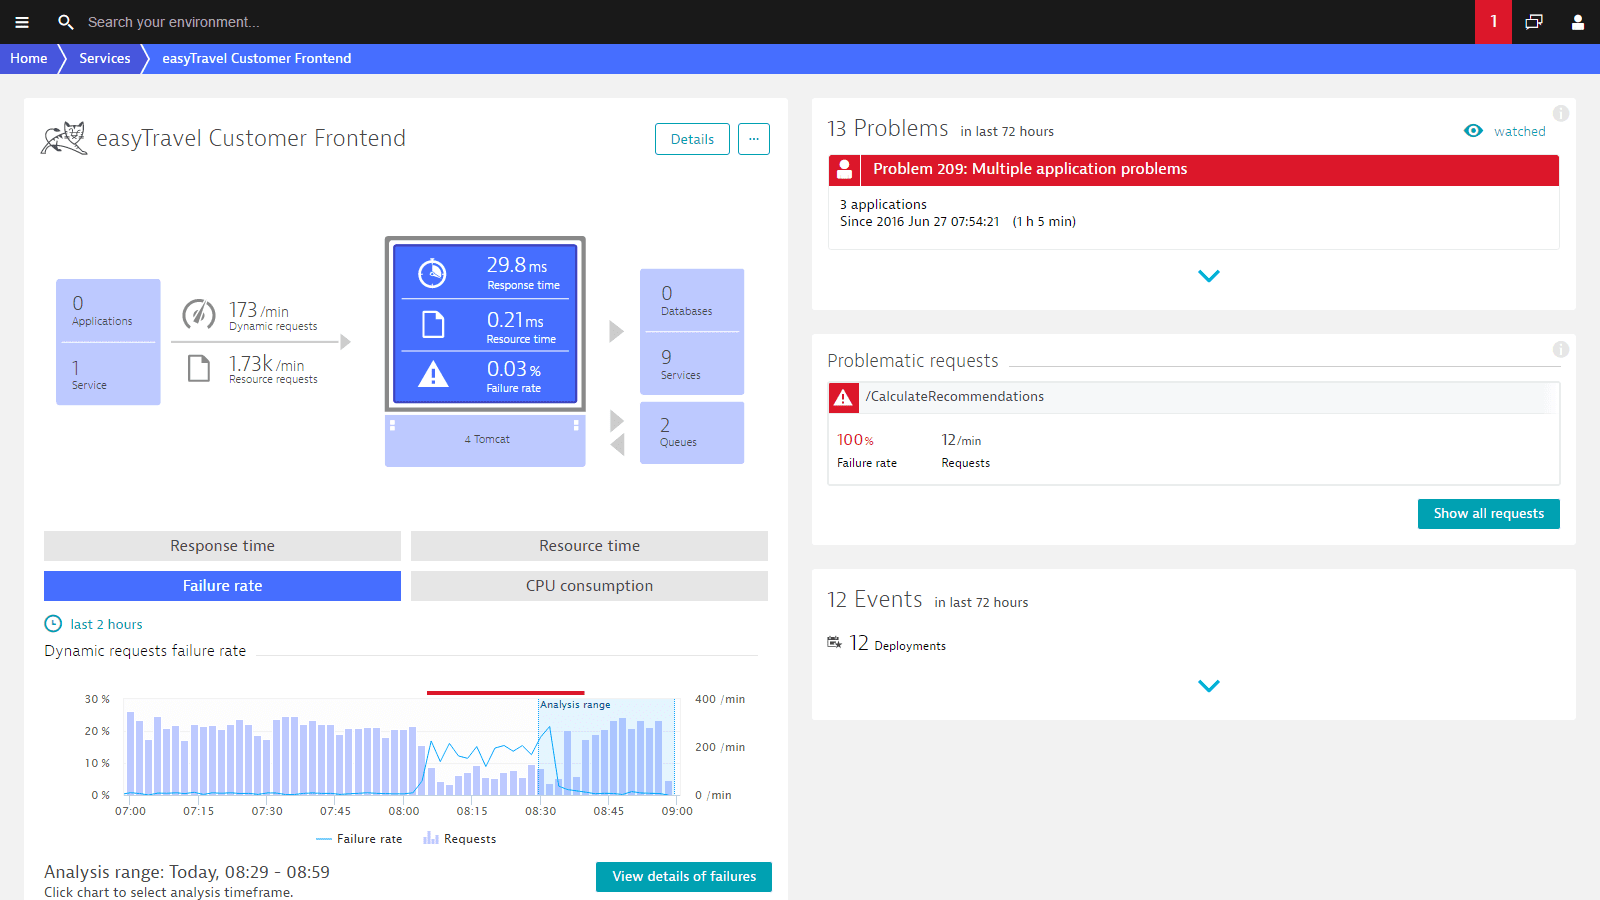
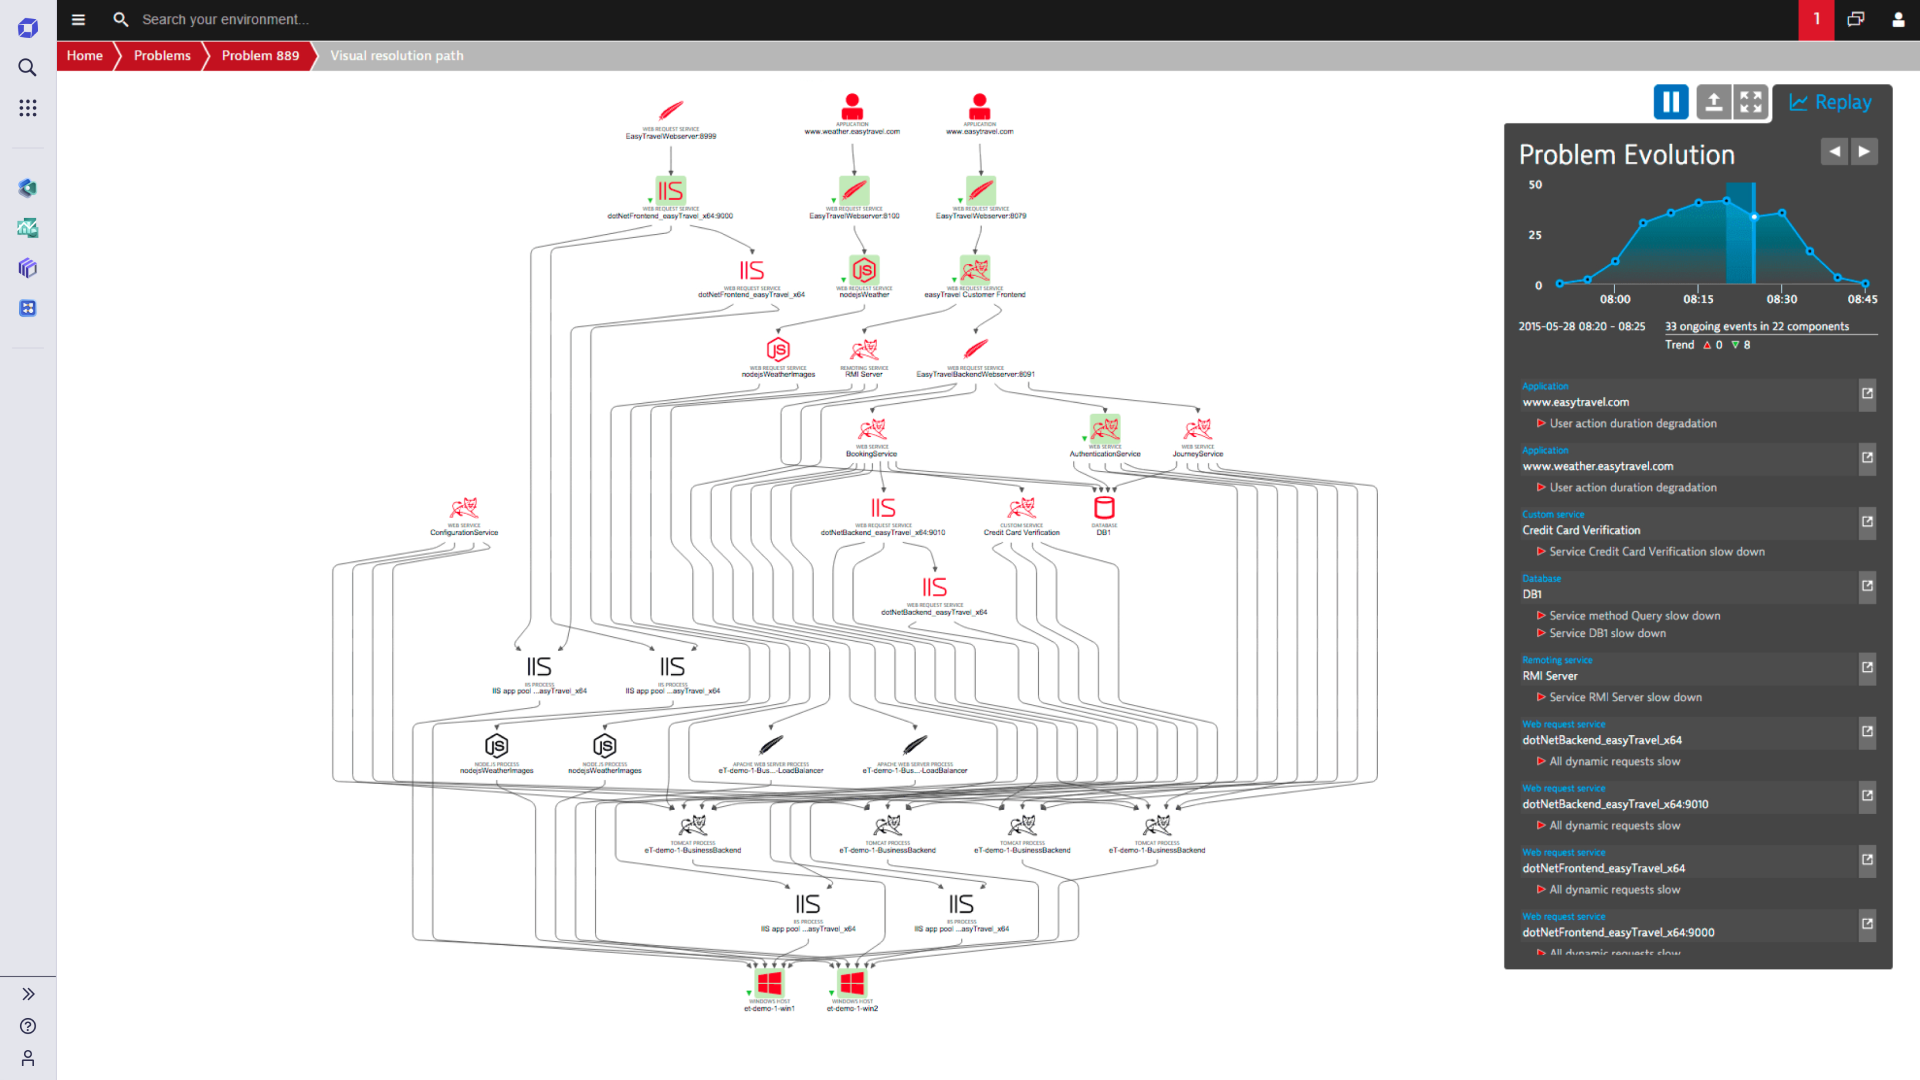
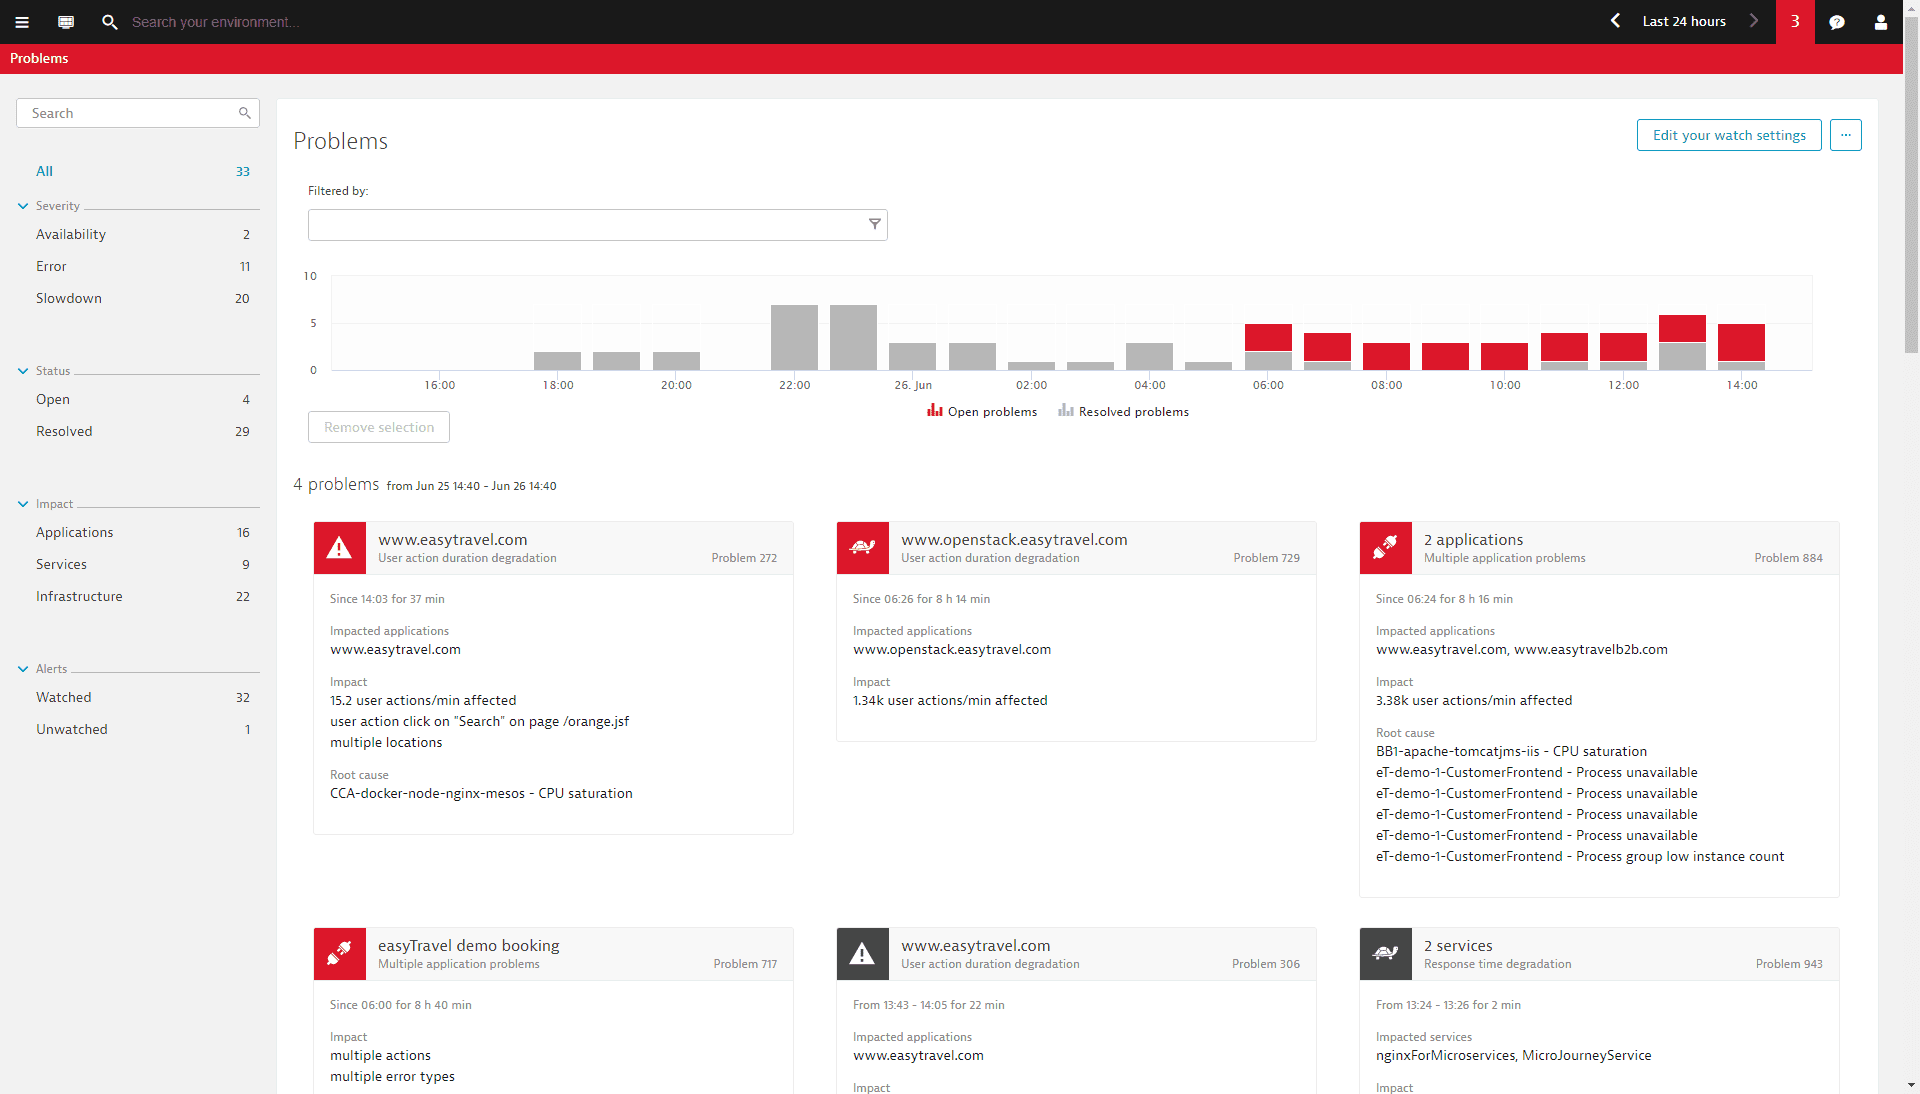
Dynatrace tells you the root cause of Java problems!
Dynatrace detects and diagnoses problems in real time, pinpointing the root cause down to the offending code before your customers are even affected.
- Detect availability and performance problems across your stack proactively.
- Dynatrace directly pinpoints components that are causing problems with big data analytics of billions of dependencies within your application stack.
- A visual replay of problem evolution helps you understand how problems evolved over time.

Start Java performance monitoring in under 5 minutes!
Sign up, deploy our agent and get unmatched insights out-of-the-box.
Locate bottlenecks in your application code
Dynatrace enables you to dig into your applications and find hotspots at the code level. Locate problematic methods with CPU or network bottlenecks within the execution call stack.
Your ability to find and resolve performance issues will improve significantly with Dynatrace Java monitoring.

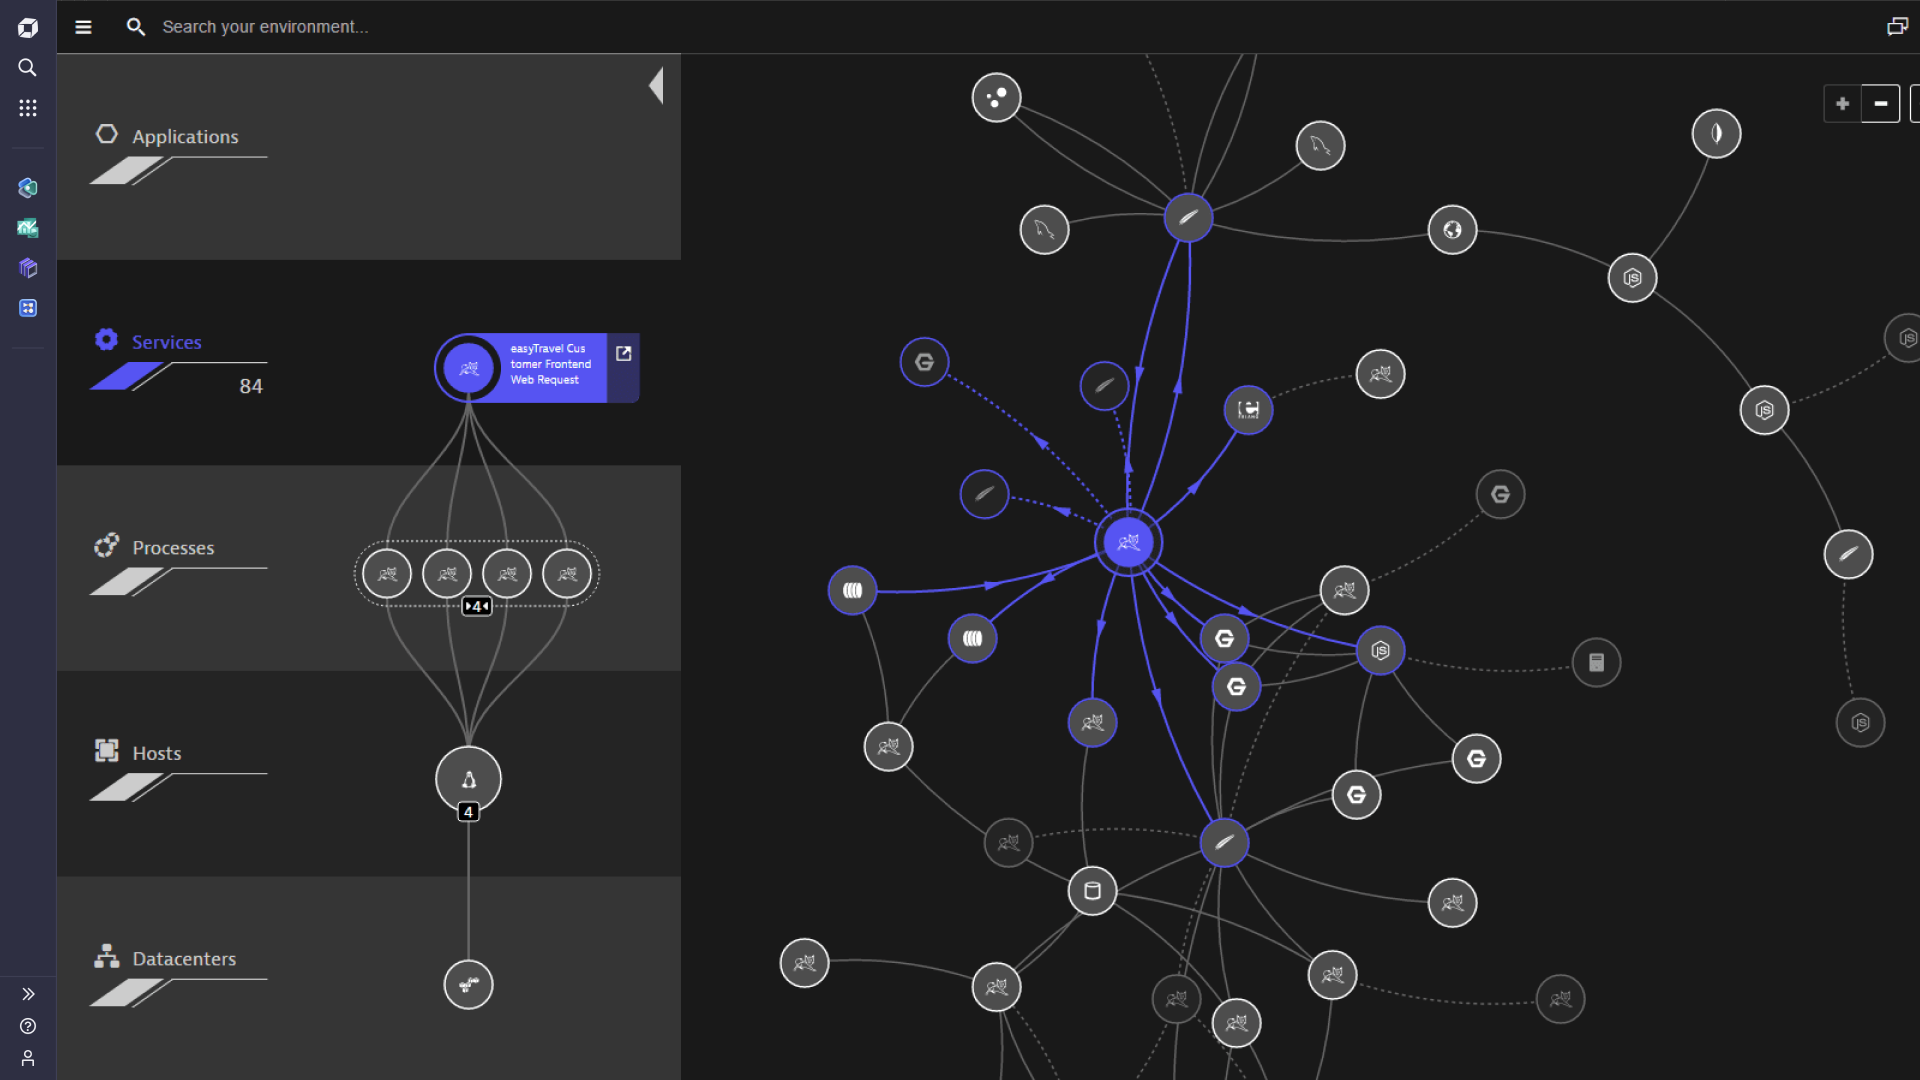
Automatically discover and map applications and infrastructure
Dynatrace automatically detects and visualizes your web application and its dependencies end to end: from website to application to container, infrastructure and cloud.
- Dynatrace Smartscape provides an interactive map of your application across all layers.
- See how all components relate to and communicate with one another.
- Our unique solution was designed for cloud environments where instances are rapidly created and deployed, making it a perfect fit for monitoring microservices environments.
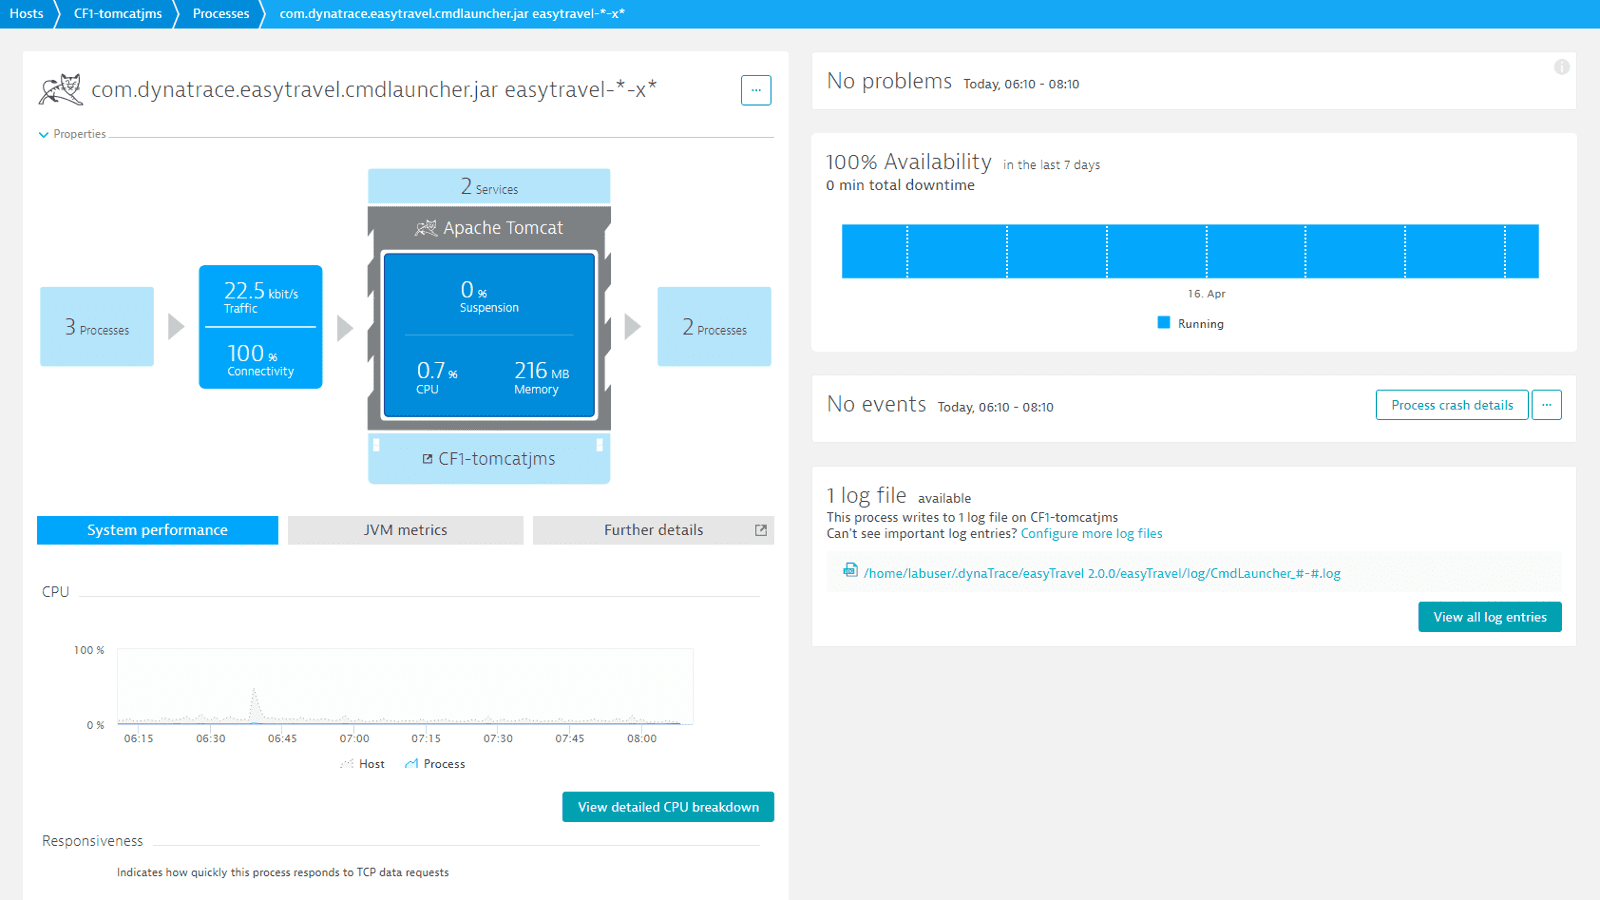
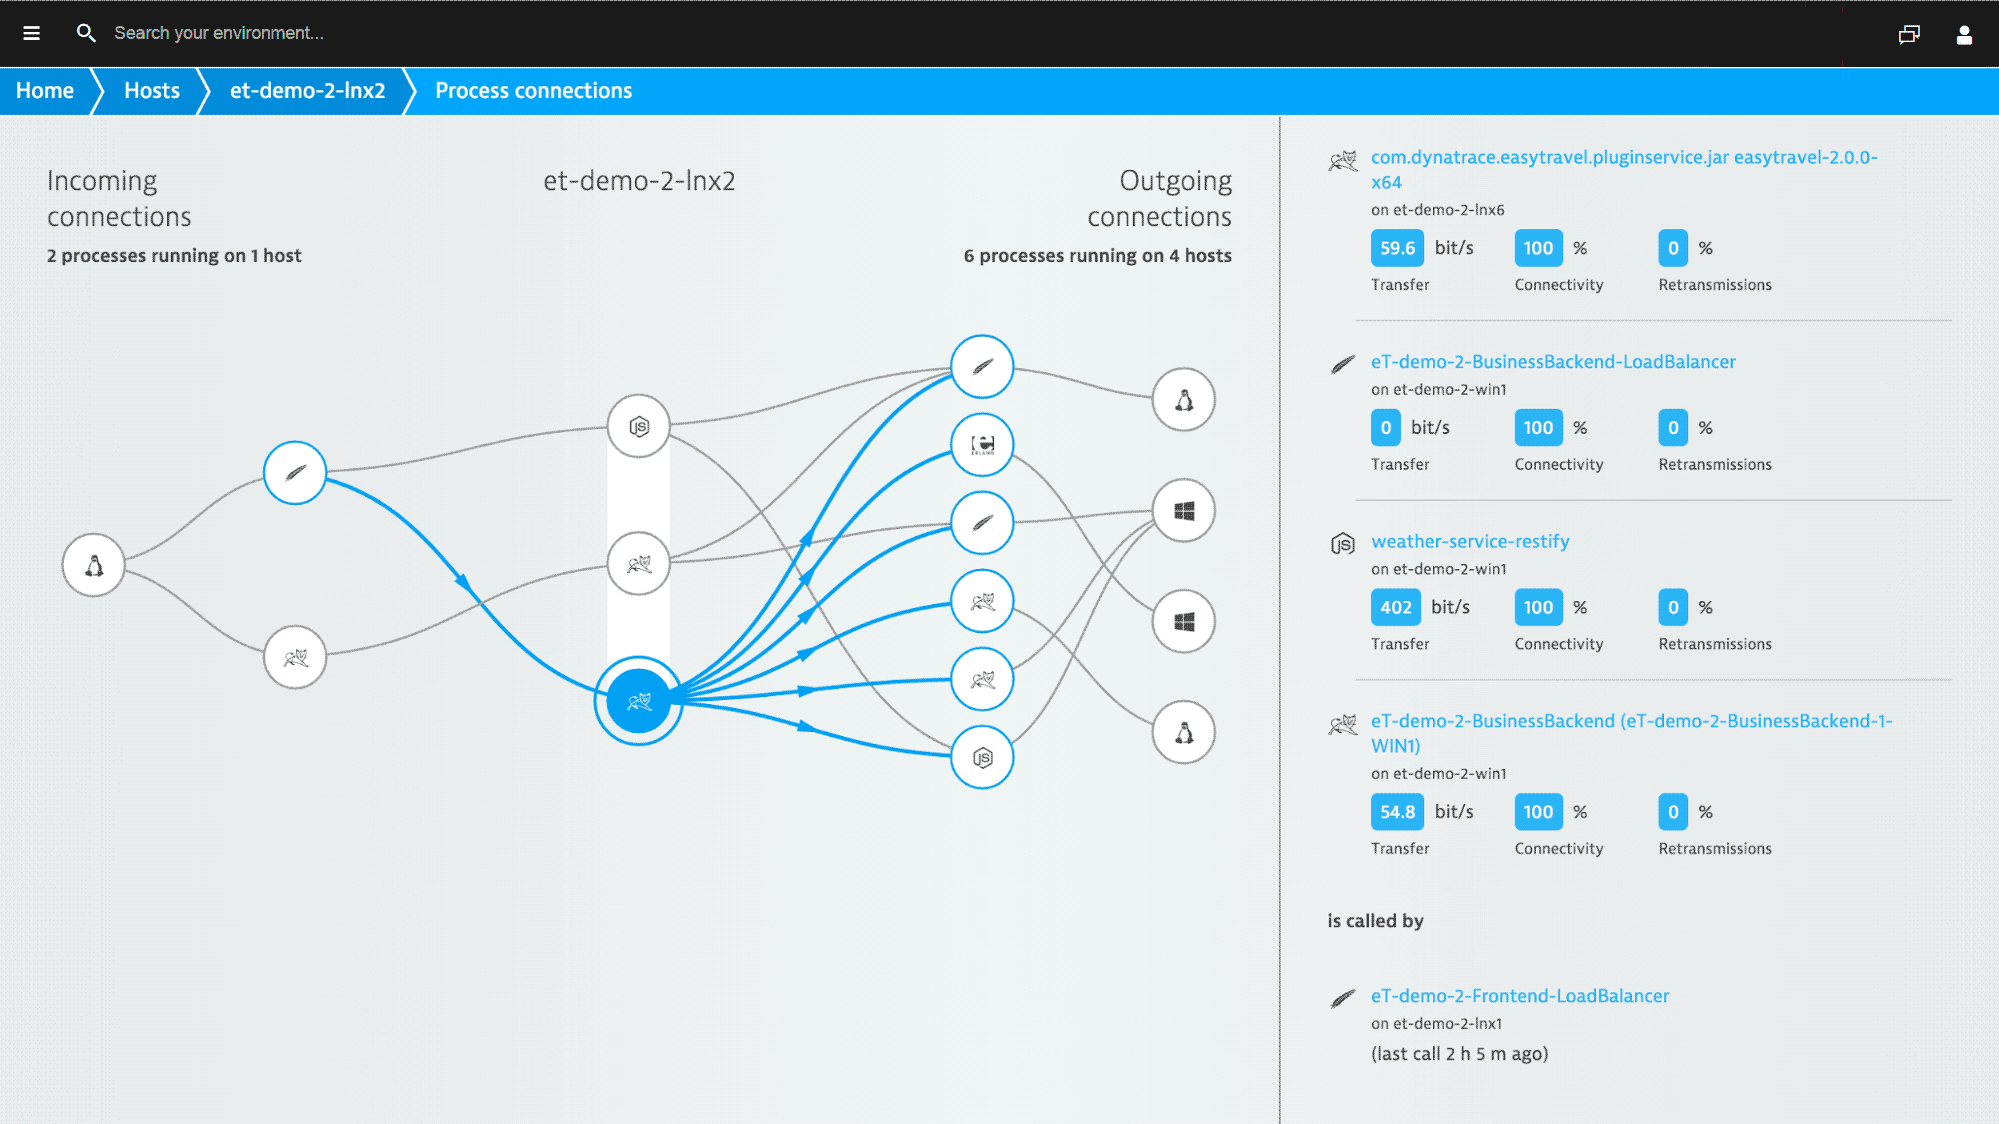
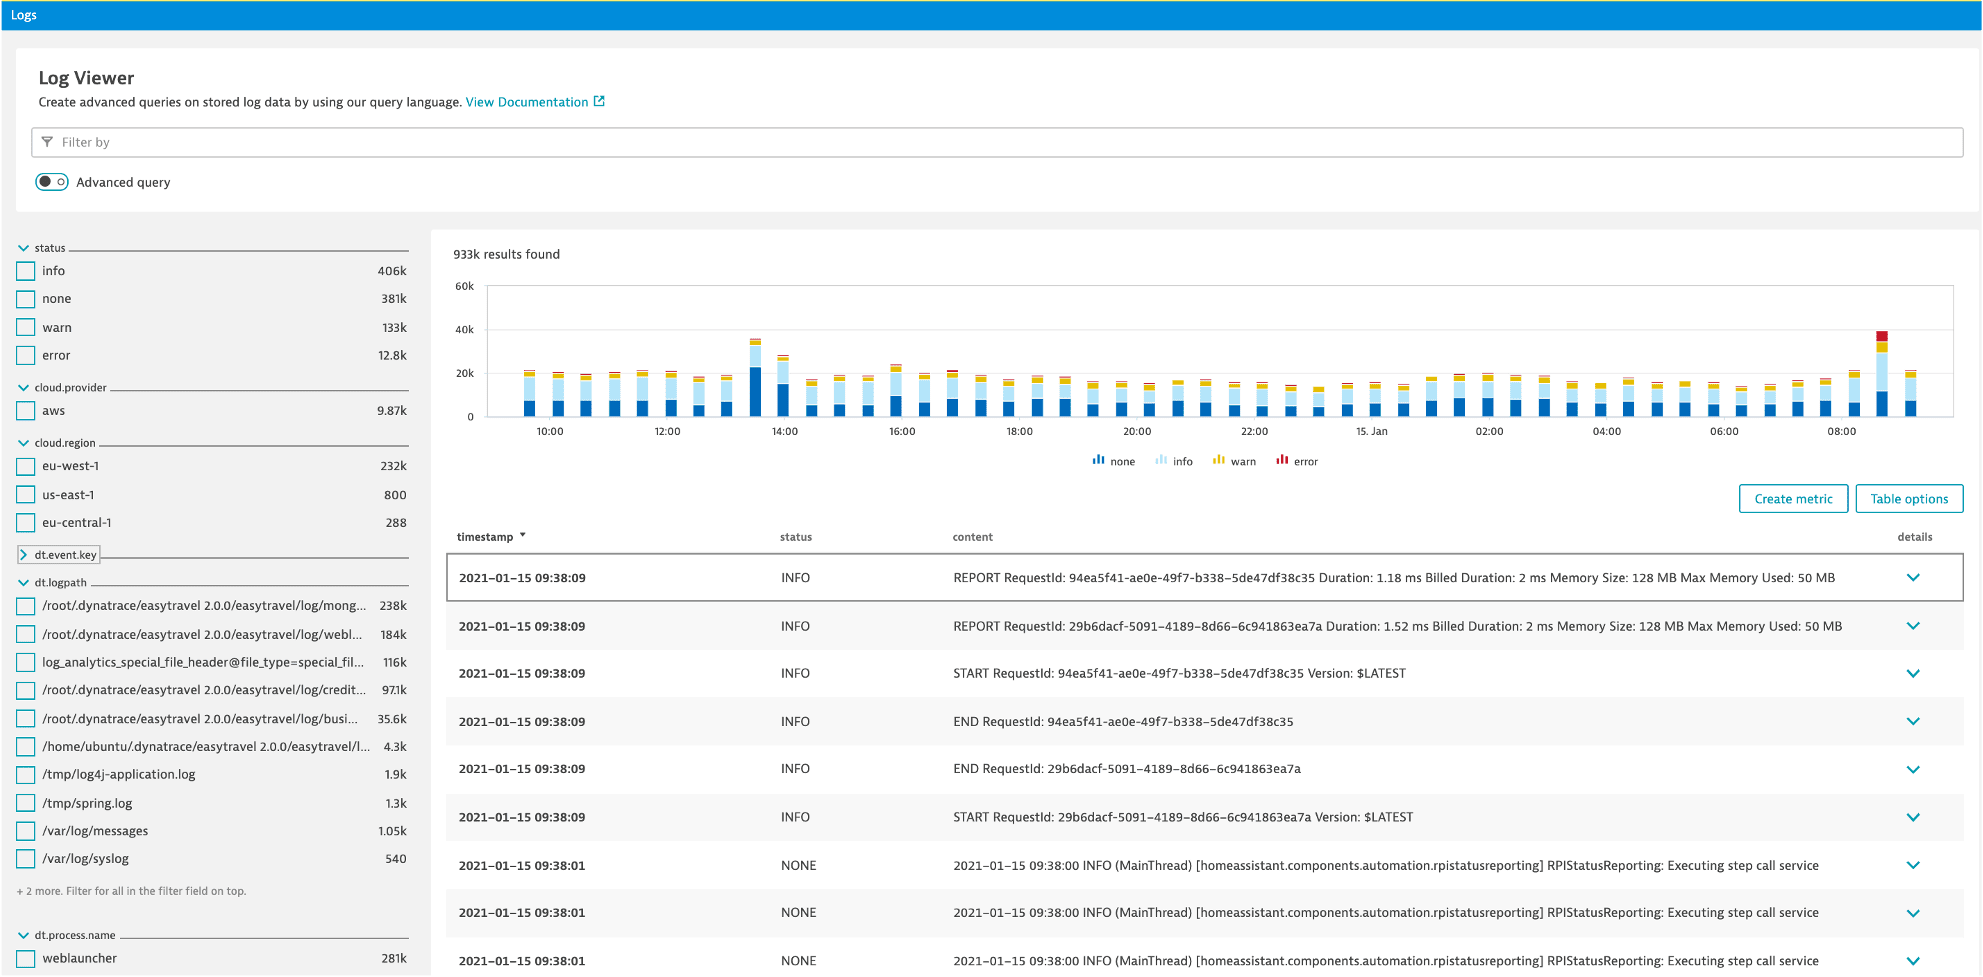
Get the full picture including network health and log file analysis
Dynatrace provides a clear picture of all inbound and outbound process connections over your network interfaces (both physical and virtual) and automatically discovers all log files on your monitored hosts and processes.
- Leverage actual data throughput and quality of network connections between communicating hosts and processes.
- Gain direct access and search the log content of all your system’s mission-critical processes.
- Relevant log messages or networking anomalies are factored into the root-cause analysis of problems.
Integrate with continuous integration and delivery
Dynatrace integrates seamlessly with popular CI/CD systems, making performance-driven development and delivery a continuous process.
- We integrate with your DevOps toolchain to automate issue detection during QA and test.
- Detect regressions automatically, comparing production and dev builds at the code-level.
- A single dashboard displays the current build status from both the functional and performance perspectives.

Start your 15-day free Dynatrace trial today!
Want to see what intelligent observability powered by AI and automation can do for you? Get a free trial of the Dynatrace platform now.


